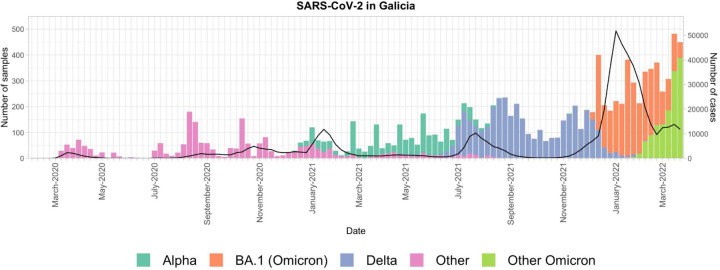
Figure 1. SARS-CoV-2 epidemic waves in Galicia from February 2020 to March 2022.
Number of samples available in the GISAID database (left-axis; bars) and diagnosed cases recorded by the Spanish National Epidemiology Center (CNE) (right-axis; black line) for Galicia from February 2020 to March 2022. Bar colors represent different lineages or variants, as explained in the legend.

