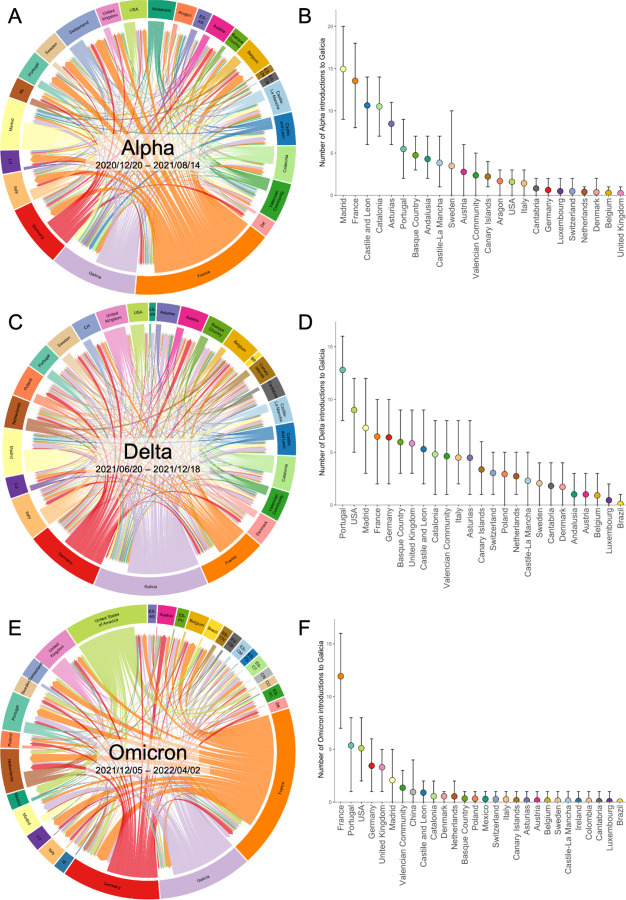
Figure 2. SARS-CoV-2 introductions into Galicia during the Alpha wave.
Left: Circular migration flow plot based on the Markov jumps between multiple countries and several Spanish regions, including Galicia. (A: Alpha; C: Delta; E: Omicron). Right: Mean and 95% highest posterior density (HPD) number of transitions from Spain and other countries to Galicia, computed from all the trees from the posterior distribution. (B: Alpha; D: Delta; F: Omicron). Correspondence between codes ISO 3166–2 and the complete name of the location in Supplementary Table 2.

