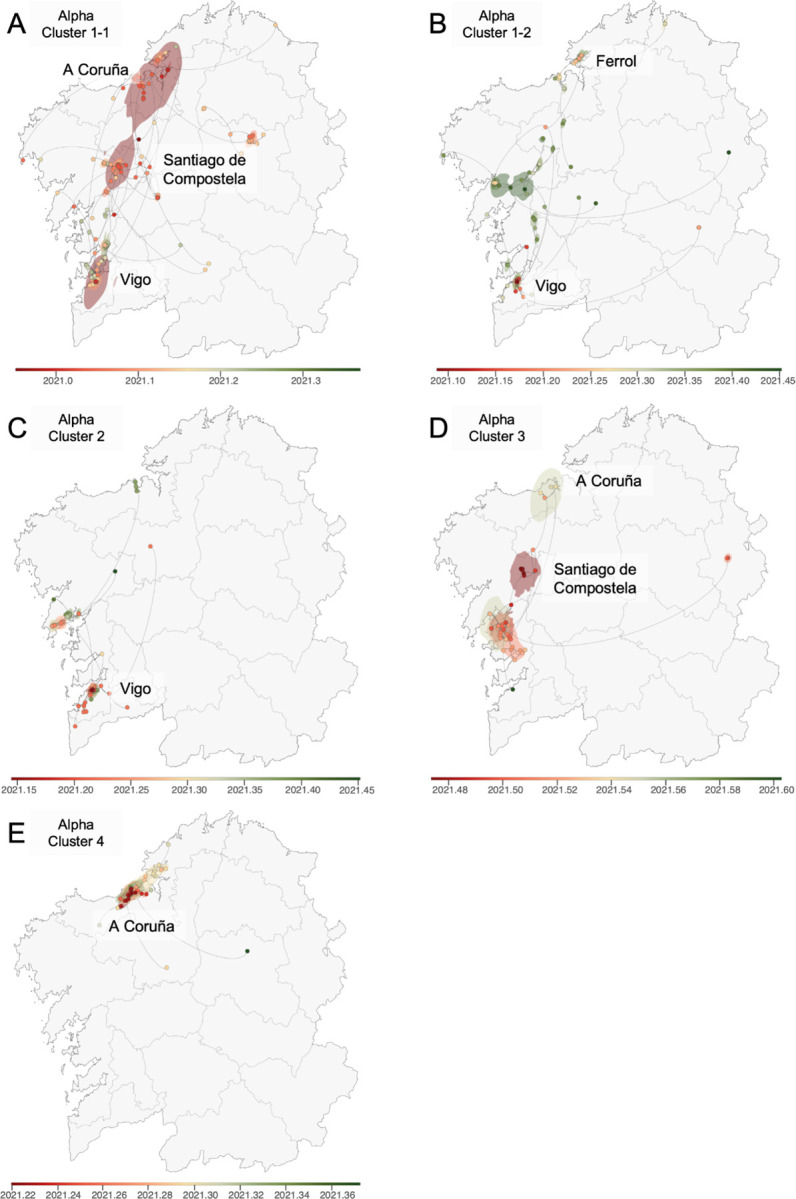
Figure 3. Continuous phylogeographic reconstruction of selected Alpha clusters.

A) Cluster 1–1; B) Cluster 1–2; C) Cluster 2; D) Cluster 3; E) Cluster 4. We map the maximum clade credibility (MCC) trees and overall 80% highest posterior density (HPD) regions reflecting the uncertainty related to the Bayesian phylogeographic inference. MCC trees and 80% HPD regions are based on 1,000 trees sampled from each posterior distribution and colored based on their time of occurrence. The direction of viral lineage movement is indicated by edge curvature (anti-clockwise).
