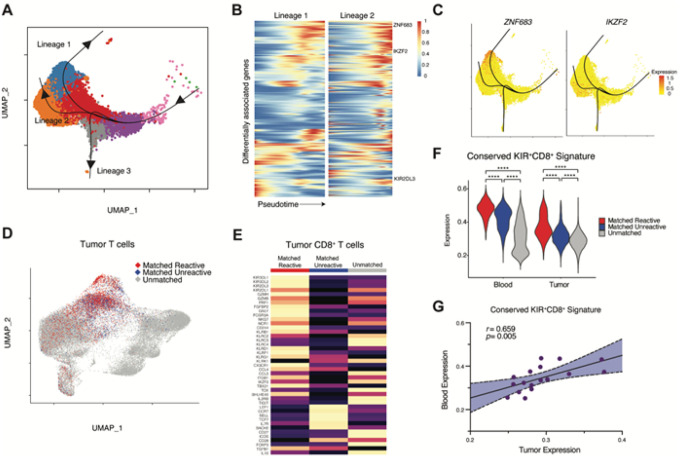
Figure 3. Relationship between circulating and tumor KIR+CD8+ tumor antigen reactive T cells.
A) UMAP dimensionality reduction plot of circulating KIR+CD8+ tumor antigen reactive T cells and all clonally related cells with superimposed pseudotime trajectory curves. Naive-like T cells were defined as the pseudotime start point (right side of the plot). KIR+CD8+ reactive T cells are enriched along lineage 2. B) Diffusion heatmap displaying differentially associated genes along pseudotime (x-axis) in lineage 1 (left) as compared with lineage 2 (right). C) Gene expression of ZNF683 (left, encodes the transcription factor Hobit) and IKZF2 (right, encodes the transcription factor Helios) displayed on UMAP plots. D) UMAP dimensionality reduction plot of tumor T cells labeled with clonal relationship with circulating, differentially abundant predicted-reactive or predicted-unreactive CD8+ T cells. E) Heatmap of the expression of hallmark KIR+CD8+ regulatory T cell genes in tumor T cells. F) Violin plots summarizing the conserved KIR+CD8+ T cell gene signature. Between group differences are measured by Wilcoxon signed-rank testing with continuity correction (q < 0.05, **** p < 0.001). G) The correlation between the conserved KIR+CD8+ T cell gene signature in tumor (x-axis) or blood (y-axis) CD8+ T cells.

