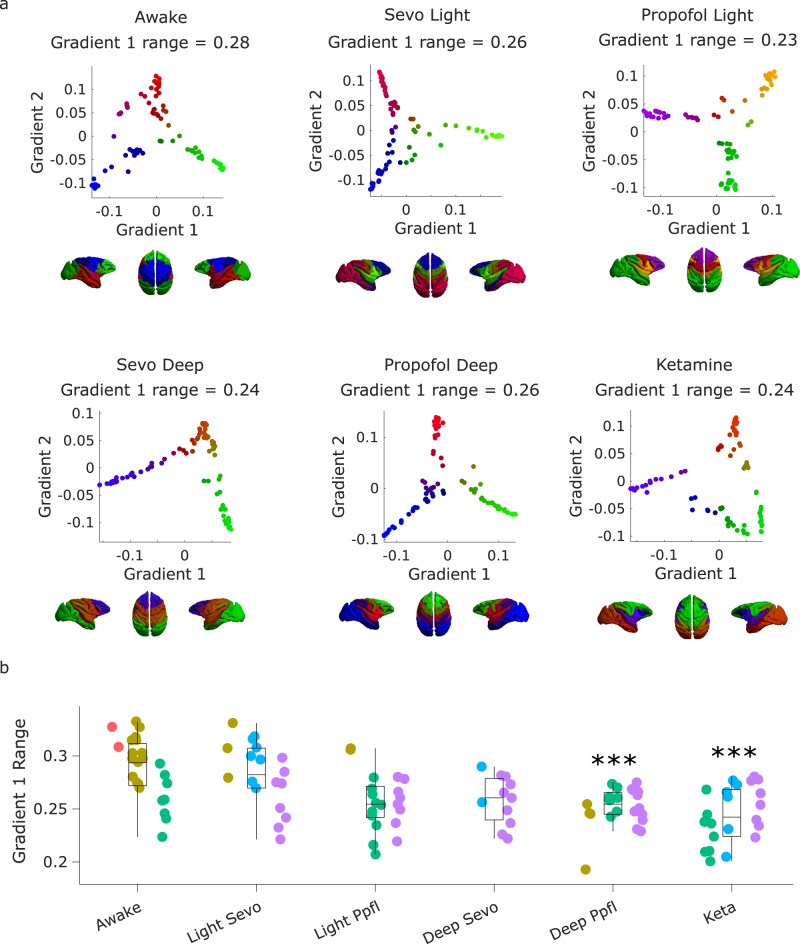
Fig. 1. Anaesthetic-induced collapse of the principal gradient of macaque functional connectivity.
a | Scatter plots show the first two principal gradients of macaque functional connectivity (obtained from diffusion graph embedding: see “Methods”) for the group-averaged FC matrix of the awake condition, and each anaesthetised condition. The gradients are also plotted on the cortical surface of the macaques, with colour representing the position of each region along each gradient. b | The range of the principal gradient of macaque functional connectivity across wakefulness and different anaesthetic conditions. Box plots: central line, median; box limits, upper and lower quartiles; whiskers, 1.5× interquartile range; dots of the same colour are provided by the same animal. ***p < 0.001 from linear mixed effects modelling (two-sided, FDR-corrected), compared against Awake condition; see Supplementary Data 1 for statistical results. N = 24 runs from 3 animals for Awake; 18 runs from 3 animals for Light Sevoflurane; 21 runs from 3 animals for Light Propofol; 11 runs from 2 animals for Deep Sevoflurane; 23 runs from 3 animals for Deep Propofol; 22 runs from 3 animals for Ketamine anaesthesia.

