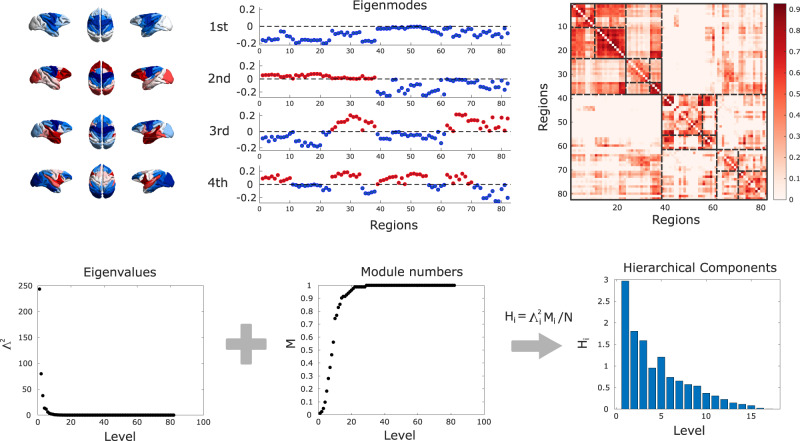
Fig. 3. Hierarchical integration quantified from brain functional eigenmodes.
Each eigenmode (except the first) divides cortical regions into two groups, at progressively finer scales. Combining the different groupings identifies a hierarchical sub-division of the functional connectome into nested modules. The relative weight of each eigenmode is given by its associated eigenvalue. The first eigenmode corresponds to integration, and segregation is then reflected by the contribution of the other eigenmodes.

