
Fig. 8. Relating structural and functional eigenmodes of the brain to changes in arousal scores induced by anaesthesia and thalamic deep brain stimulation.
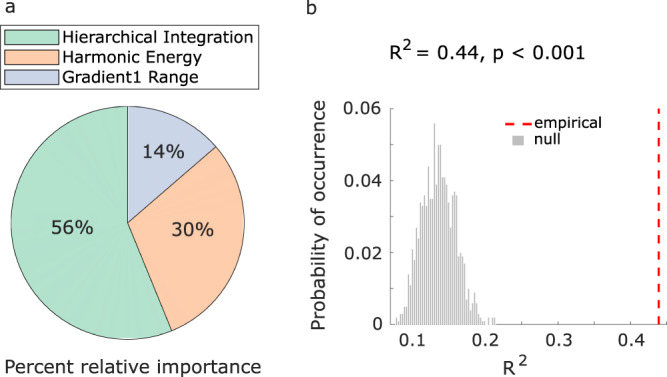
a | Dominance analysis compares all possible models obtained from distinct combinations of predictors, to distribute the variance explained between the predictors, in terms of percentage of relative importance (represented as pie chart). b | We establish the statistical significance of our model (p < 0.001) using a non-parametric permutation test (one-sided), by comparing the empirical variance explained (R2) against a null distribution of R2 obtained from repeating the multiple regression with randomly reassigned arousal scores.