Figure 10.
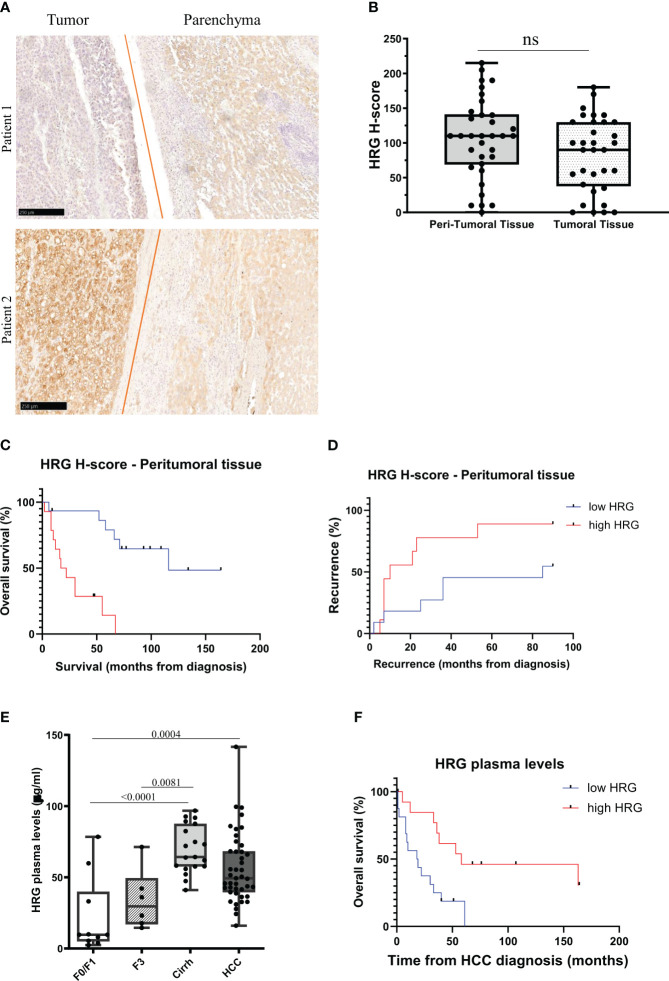
HRG protein expression in MASLD/MASH-related HCC patients. IHC analysis of HRG performed on paraffin-embedded human liver specimens from MASLD/MASH-related HCC patients (n = 37, grades G2 to G3). Original magnification as indicated (A). HRG expression was semi-quantitatively scored blinded by a pathologist by means of histological score (H-score) (B). Kaplan–Meier curves of overall survival (C) and recurrence (D) according to HRG peritumoral H-score in MASLD/MASH-related HCC patients (C, D). Statistical analysis was performed using log-rank (Mantel–Cox) test (C, D). Plasma concentration of HRG measured in a cohort of patients (N = 78) with different stages of disease progression including 10 patients with a F0/F1 score, 25 patients with a F3/F4 score (six F3 and 19 F4) and 43 MASLD/MASH patients carrying HCC. Cirrh, cirrhotic liver; F, fibrosis score (E). Kaplan–Meier curves of overall survival according to HRG plasma levels in MASLD/MASH-related HCC patients (F). Statistical analysis was performed using log-rank (Mantel–Cox) test (F). ns, not significant.

