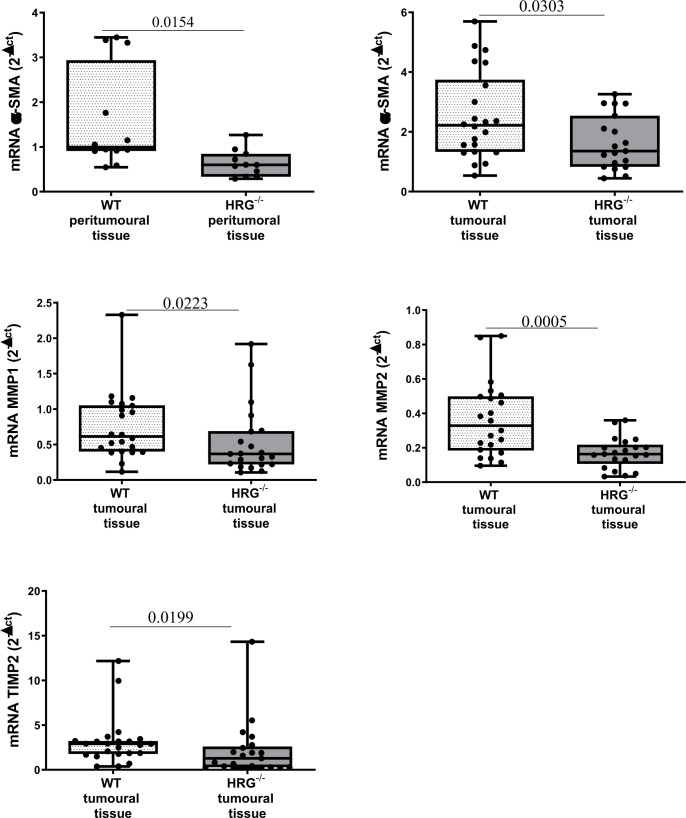
Figure 6.
HRG deletion affects the development of experimental MASH-HCC by downregulating fibrogenesis. qPCR analysis of αSMA, MMP1, MMP2, and TIMP2 transcripts performed in HCC tumor masses or peri-tumoral tissue from 12 WT mice or from 11 HRG–/– mice. The mRNA values are expressed as fold increase over control values after normalization to the TBP gene expression. The results are expressed as means ± SD. The boxes include the values within the 25th and 75th percentile, whereas the horizontal bars represent the medians. The extremities of the vertical bars (10th–90th percentile) comprise 80% of the values. Statistical differences were assessed by Student’s t-test or Mann–Whitney test for non-parametric values.

