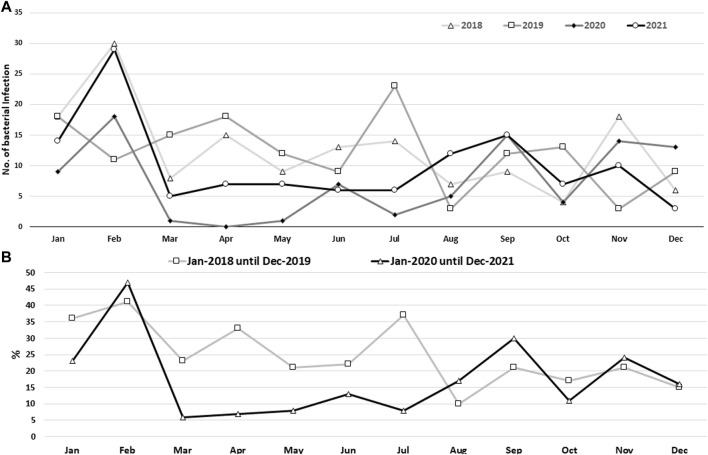
FIGURE 2.
Bacterial sepsis rate based on monthly records (A) and the monthly record for phase I (pre-COVID-19 pandemic) and phase II (during the COVID-19 pandemic) (B) for the four-year data, 2018–2021. Using the Chi-square test, a statistically significant difference (p < 0.0001) was found between the various monthly data sets.

