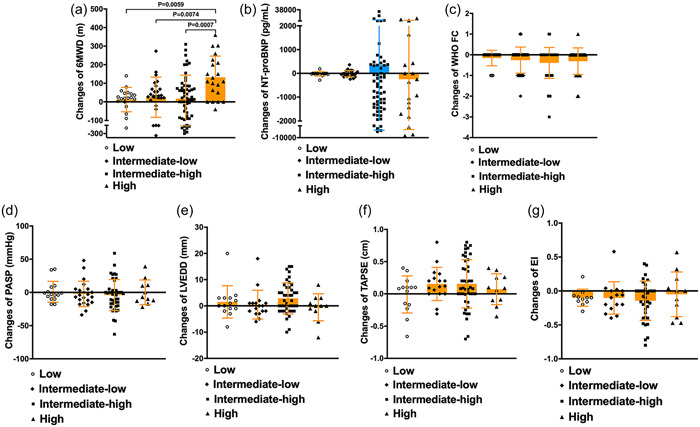
Figure 2.

Comparison of changes before and after 6 months of treatment in different risk groups. (a) Change of 6‐min walk distance (6MWD); (b) Change of N‐terminal fragment of probrain natriuretic peptide (NT‐proBNP); (c) Change of WHO functional class (WHO‐FC); (d) Change of pulmonary artery systolic pressure (PASP); (e) Change of left ventricular end diastolic diameter (LVEDD); (f) Change of tricuspid annular plane systolic excursion (TAPSE); (g) Change of eccentricity index (EI).
