
FIGURE 2.
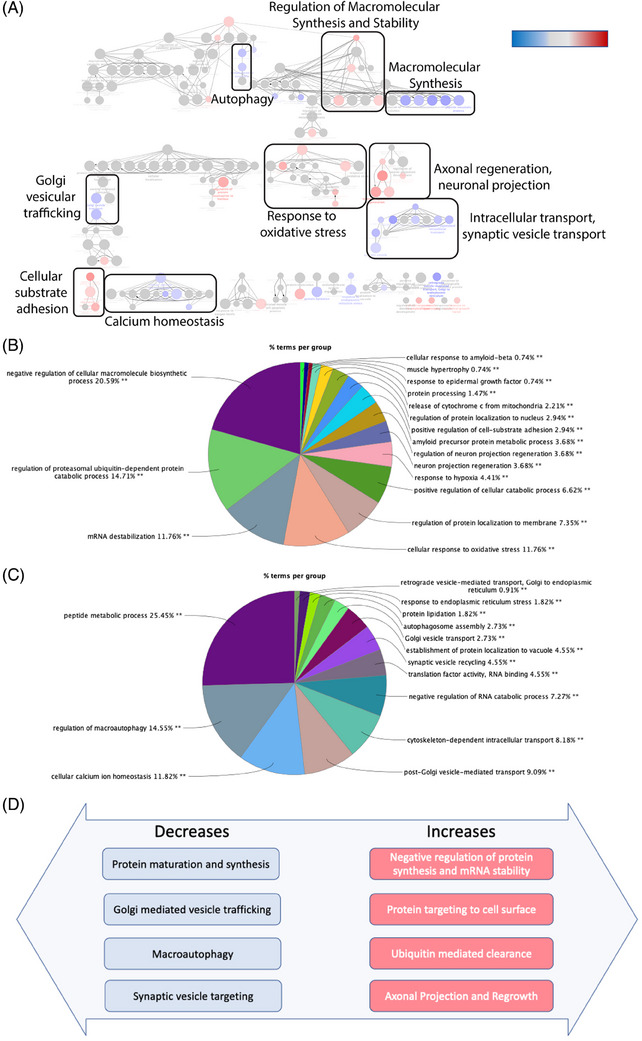
Proteostasis regulation in LOAD patients. This figure shows changes in families of related biological processes associated with the AD endophenotypic area "proteostasis". We developed computational models for 19 endophenotypes associated with LOAD for large scale data integration. All the graphs in this figure are taken from analysis done utilizing the genes associated with proteostasis. In (A)–(C), we employ the cytoscape java/R application ClueGO to map genes that are AD risk associated and either up‐ or down‐regulated. In this manner, we can identify biological processes that are specifically associated with a unidirectional shift in AD. In (A), the network of linked terms are used to heatmap the network of processes that are either upregulated (red) or down‐regulated (blue). (B) The metrics associated with global patterns of up‐regulated biological processes are grouped together into related terms and represented by lead term in the pie chart. (C) The down‐regulated processes are aggregated and shown by lead term. In (D), a conceptual representation of opposing directions of linked processes are demonstrated within macromolecular synthesis, vesicle trafficking associated with protein maturation, protein homeostasis, and synaptic function. The regulation of processes suggests a direct and oppositional response within proteostatic subdomains indicative of counter‐regulation, potentially suggestive of hormesis. AD, Alzheimer's disease; LOAD, late‐onset AD.