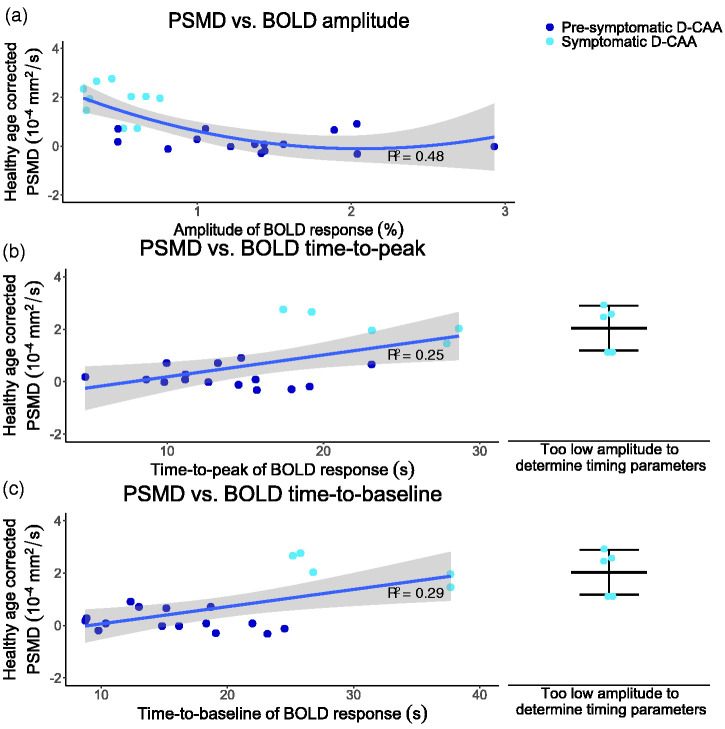
Figure 3.
Graphs showing the relations between healthy age corrected PSMD and BOLD parameters with corresponding adjusted R2 values; (a) quadratic relationship between PSMD and BOLD amplitude, (b) linear relationship between PSMD and BOLD time-to-peak, and (c) linear relationship between PSMD and BOLD time-to-baseline. In b and c, the healthy age corrected PSMD values, of symptomatic D-CAA mutation carriers of whom no timing parameter could be calculated due to minimal BOLD response to the visual stimulus, are jittered on the right side of the plot, presenting the mean and standard deviation. PSMD: Peak Width Skeletonized Mean Diffusivity; BOLD: Blood-Oxygen-Level-Dependent; D-CAA: Dutch-type Cerebral Amyloid Angiopathy.

