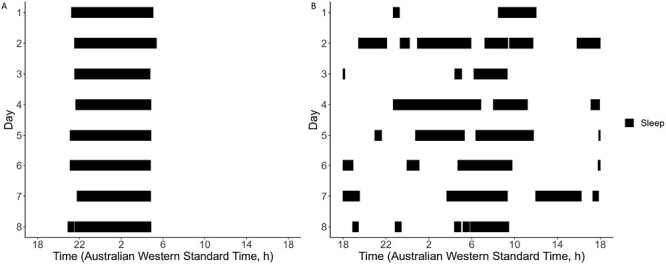
Figure 1.

Raster plot of an irregular and regular sleep pattern. Panel A represents a regular sleeper with an SRI score of 94.8 and panel B represents an individual with a sleep regularity index (SRI) score of 24.5 (irregular). The solid lines represent episodes of sleep.
