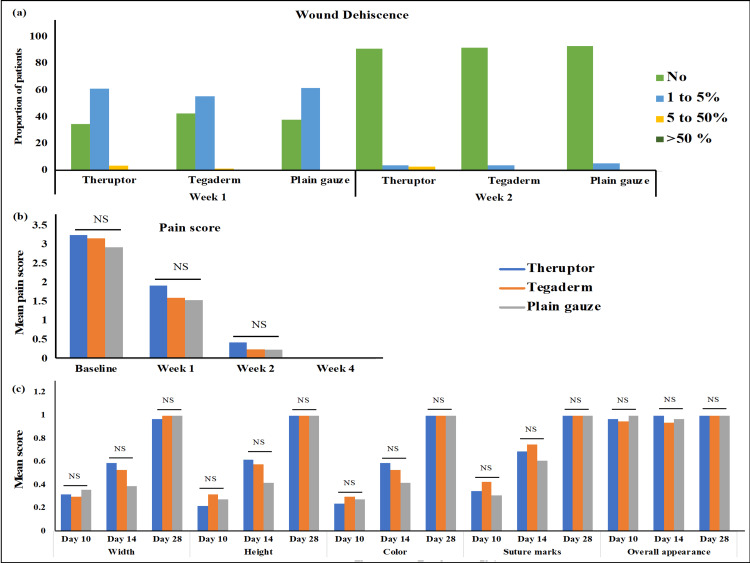
Figure 3. Wound dehiscence, wound pain assessment, and wound category among the groups.
Bar graphs representing (a) the proportions of patients belonging to different groups with the differential percentages of wound dehiscence categorized as no (0%), 1-5%, 5-50%, and >50%; (b) the mean values of wound pain scorings at baseline and weeks 1, 2, and 4; and (c) the mean values of sub-categories of Stony Brook Scar Evaluation Scale at day 10, day 14, and day 28. NS: non-significant.

