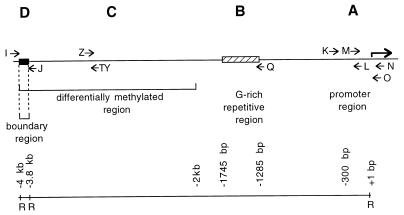
FIG. 1.
Map of the 4-kb region upstream of the H19 gene. The A, B, C, and D segments have been analyzed by in vivo footprinting. Approximate locations of LMPCR primer sets K, L, M, N, O, Q, TY, Z, I, and J are indicated by horizontal arrows. The scale underneath shows the distances from the transcription start site. R, EcoRI sites.

