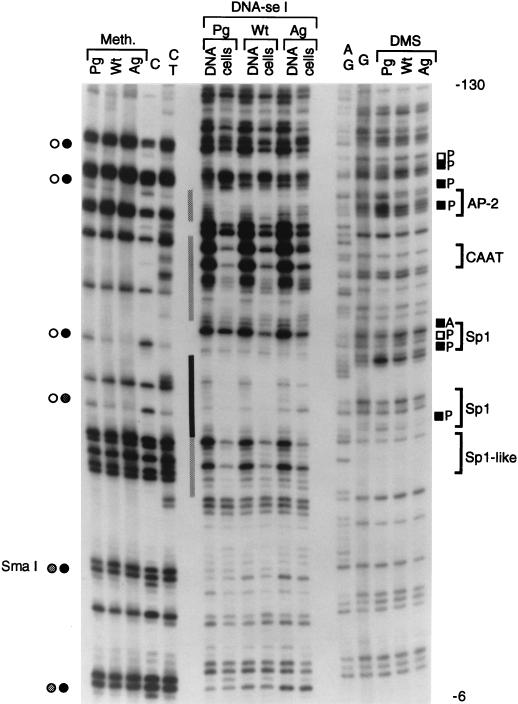
FIG. 2.
In vivo footprinting of the proximal H19 promoter in PG ES cells, WT ES cells, and AG ES cells. Methylation (Meth.), genomic DNase I footprinting (DNA-se I), and in vivo DMS footprinting (DMS) analyses were conducted. The N primer set was used for LMPCR analysis of the upper strand. Pg, PG ES cells; Wt, WT ES cells; Ag, AG ES cells. Open and filled circles indicate unmethylated and fully methylated CpGs, respectively, representing PG ES cells on the left and AG ES cells on the right; grey bars indicate partial DNase I footprints in PG ES cells; black bars indicate complete protection; black and open squares indicate increases and decreases, respectively, in DMS reactivity; A, AG ES cells; P, PG ES cells; brackets on the right side show consensus binding sites for transcription factors.

