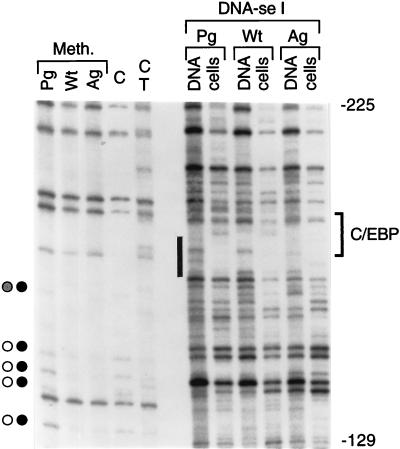
FIG. 4.
In vivo footprinting of the H19 promoter in PG ES cells and AG ES cells. The upper strand of the region between nt −129 and −225 was analyzed. The O primer set was used in LMPCR. The bracket on the right indicates the C/EBP recognition sequence, and the black rectangle indicates the protection at this site by a protein factor in PG, AG, and WT ES cells. For other details, see the legend to Fig. 2.

