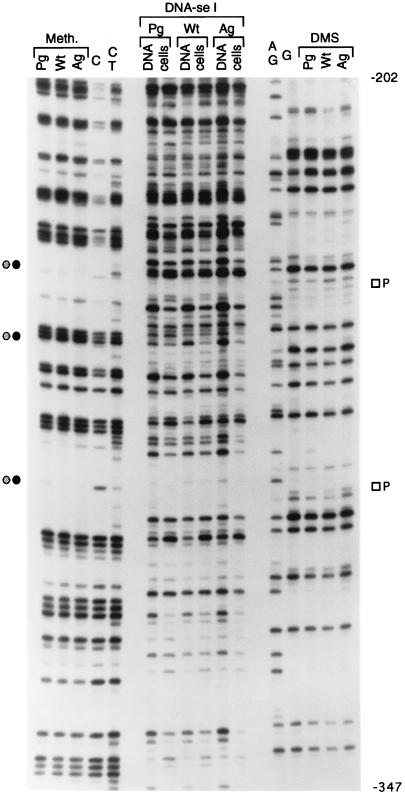
FIG. 5.
In vivo footprinting of the distal H19 promoter in PG ES cells and AG ES cells. The lower strand of the region between nt −202 and −347 was analyzed. The K primer set was used in the LMPCR. Open squares indicate protection from DMS modification in PG ES cells. For other details, see the legend to Fig. 2.

