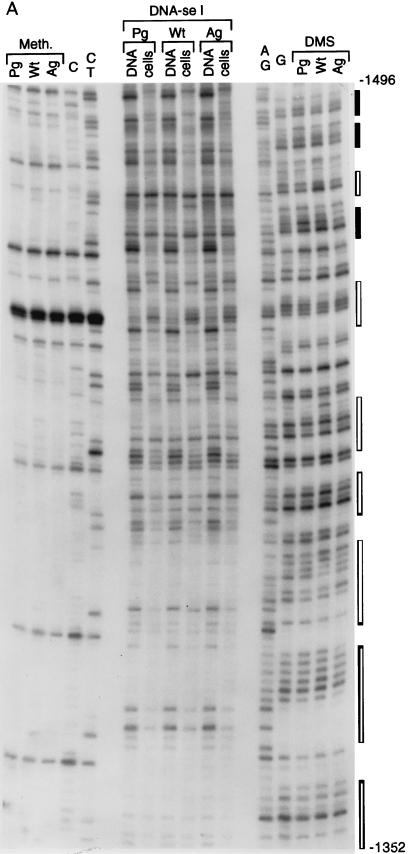
FIG. 6.
Footprinting of the G-rich repetitive region located at kb −1.3 to −1.4. (A) Autoradiogram. The Q primer set was used for LMPCR. Filled bars on the right show perfect repeats; open bars show partially homologous repeats. For other details, see legend to Fig. 2. (B) Summary of the analysis. Arrows pointing up or down indicate increased or decreased DNase I sensitivity of the in vivo-treated versus the in vitro-treated samples. No major differences in DNase I patterns were observed between PG, WT, and AG ES cells.


