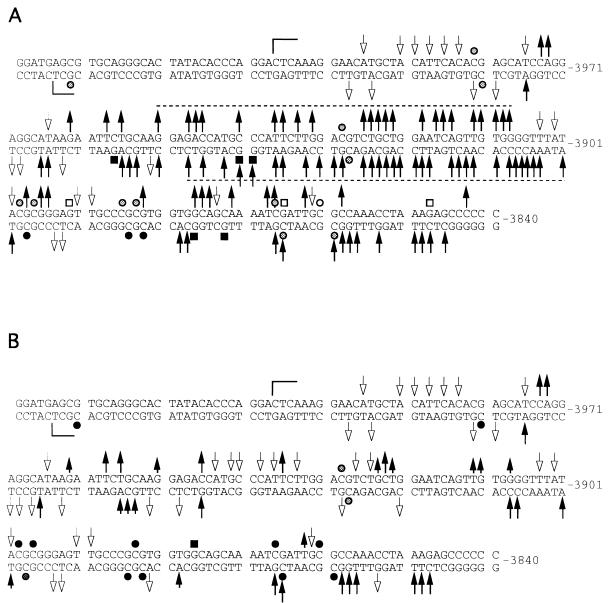
FIG. 9.
Summary of the analysis of the far upstream sequences. (A) Maternal chromosome, PG ES cells; (B) paternal chromosome, AG ES cells. Arrows pointing up or down indicate increased or decreased DNase I sensitivity of the in vivo-treated versus the in vitro-treated samples; shorter arrows indicate lower DNase I sensitivity in AG cells compared to PG cells; filled or open squares indicate increases or decreases, respectively, in DMS reactivity; open or closed circles indicate hypomethylated or hypermethylated CpGs, respectively; grey circles stand for partially methylated sites; brackets indicate the sequences analyzed.

