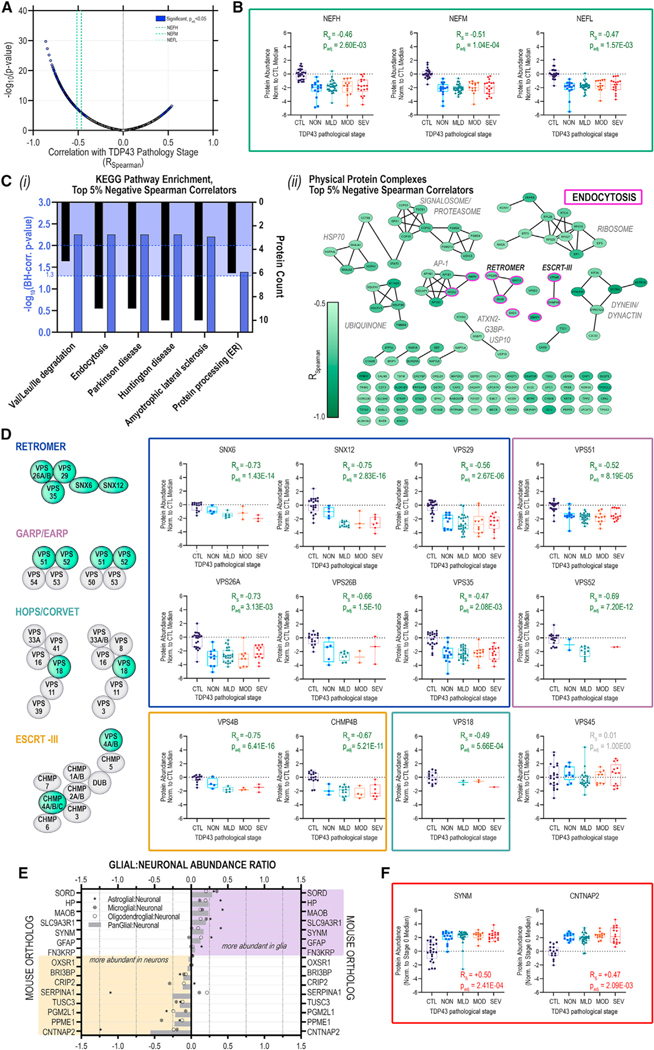
Figure 4. Neurofilament protein and retromer complex component abundances track inversely with increasing TDP-43 aggregation in postmortem human MNs.
(A) Volcano plot of Spearman rank correlations (Rs) for abundance of individual proteins vs. corresponding TDP-43 stratum; purple highlight, significantly (p-adj < 0.05, Bonferroni) correlated proteins; green dashed lines indicate NfP correlations.
(B) Distribution of NEFH, NEFM, and NEFL protein abundances in individual MNs across TDP-43+ NCI strata.
(C) (i) Over-represented (blue highlight; p-adj < 0.05, p-adj < 0.01, Benjamini-Hochberg) KEGG pathways and (ii) physical protein complex assignments for the top 5% negative TDP-43-correlators; median ± IQR; whiskers indicate range.
(D) TDP-43-stratified protein abundances trajectories for retromer (blue), GARP/EARP (mauve), HOPS/CORVET (teal), and ESCRT-III (gold); median ± IQR; whiskers indicate range.
(E) Glial:neuronal abundance ratios for proteins with significant, positive RS.
(F) TDP-43-stratified protein abundance trajectories for SYNM and CNTNAP2; median ± IQR; whiskers indicate range.

