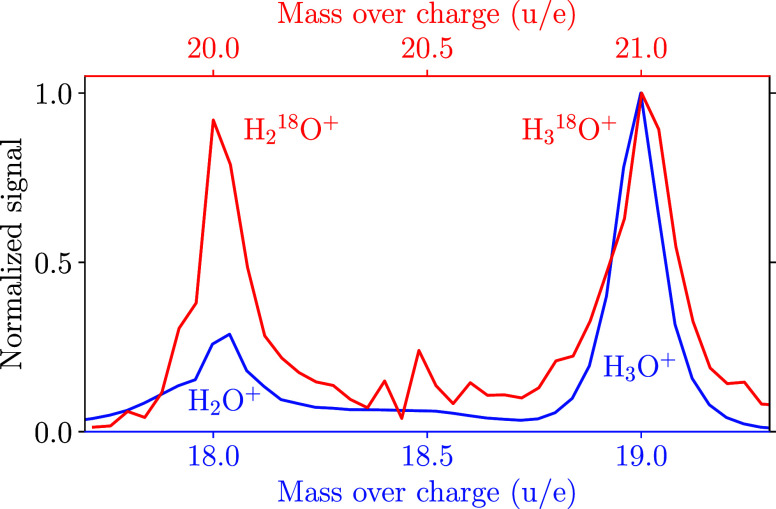
Figure 4.
Comparison of the peak-normalized mass spectra including the signals assigned to (blue) H2O+ and H3O+ and (red) H218O+ and H318O+. The red line is background-corrected to exclude the background of the H218O+ peak centered at 20 u/e. This is shown in Figure S6 in the Supporting Information. See also the text for details on possible small 17O backgrounds.

