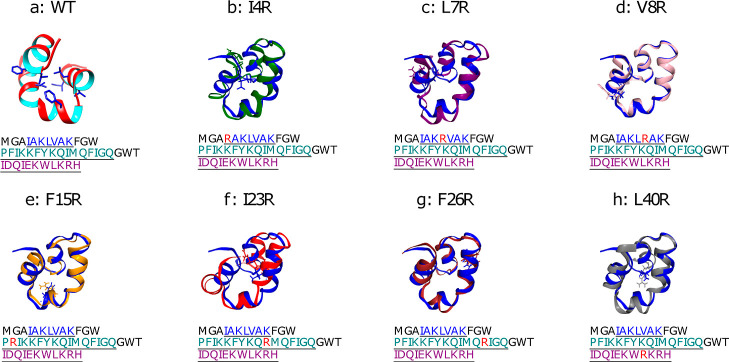
Figure 1.
Structure of enterocin 7B (PDB 2M60, WT) in panel a shown as a ribbon diagram with the inner and outer faces shown in cyan and red, highlighting the residue locations (in licorice) that are muted to construct the seven mutants shown in panels b–h, as labeled. In the latter seven panels, the (WT) is also included in blue to highlight the resulting differences in the minimum energy structures. The orientation of the WT in panels b–h is the same, but differs from that in panel a in order to highlight the differences in structure to the mutants.

