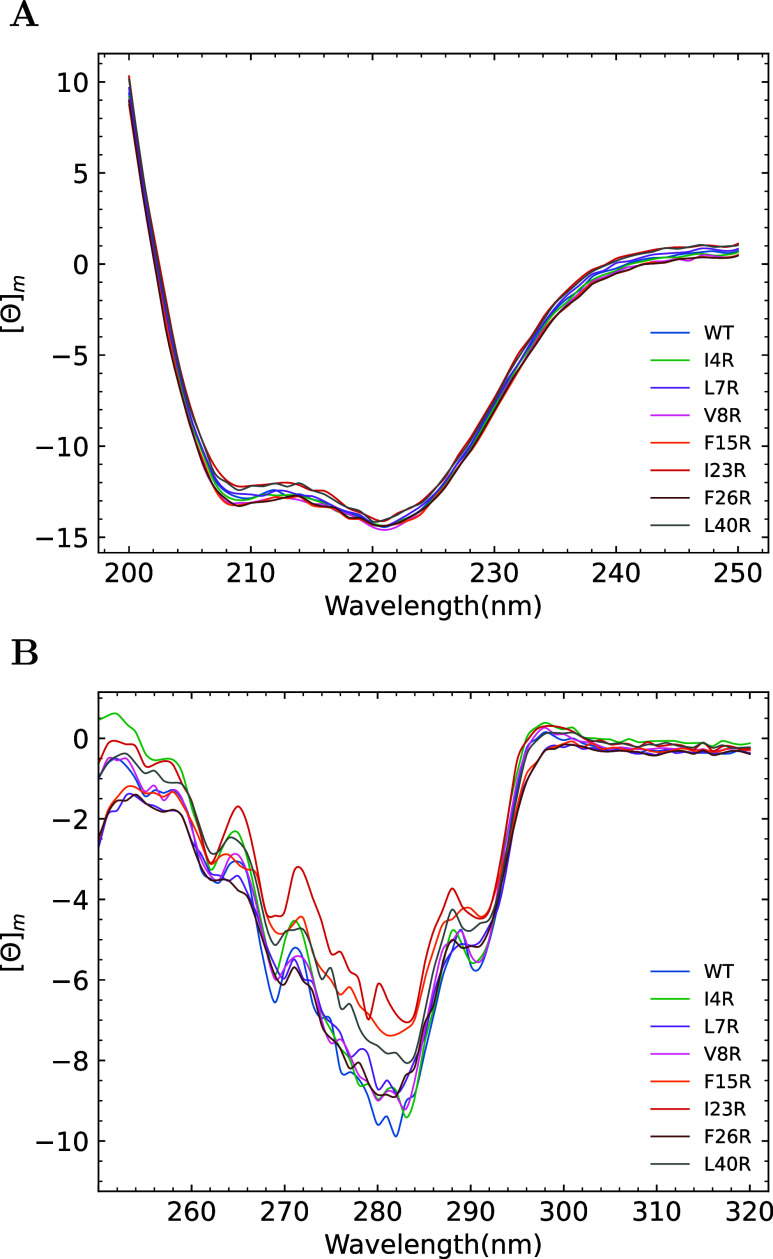
Figure 2.
Secondary and tertiary structural analysis of the enterocin peptides. All presented CD spectra are presented as the average of three independent determinations. (A) Far UV CD spectra plotted as the mean molar ellipticity versus wavelength at 10 μM peptide. (B) Near UV spectra plotted as the mean molar ellipticity versus wavelength at 90 μM peptide.

