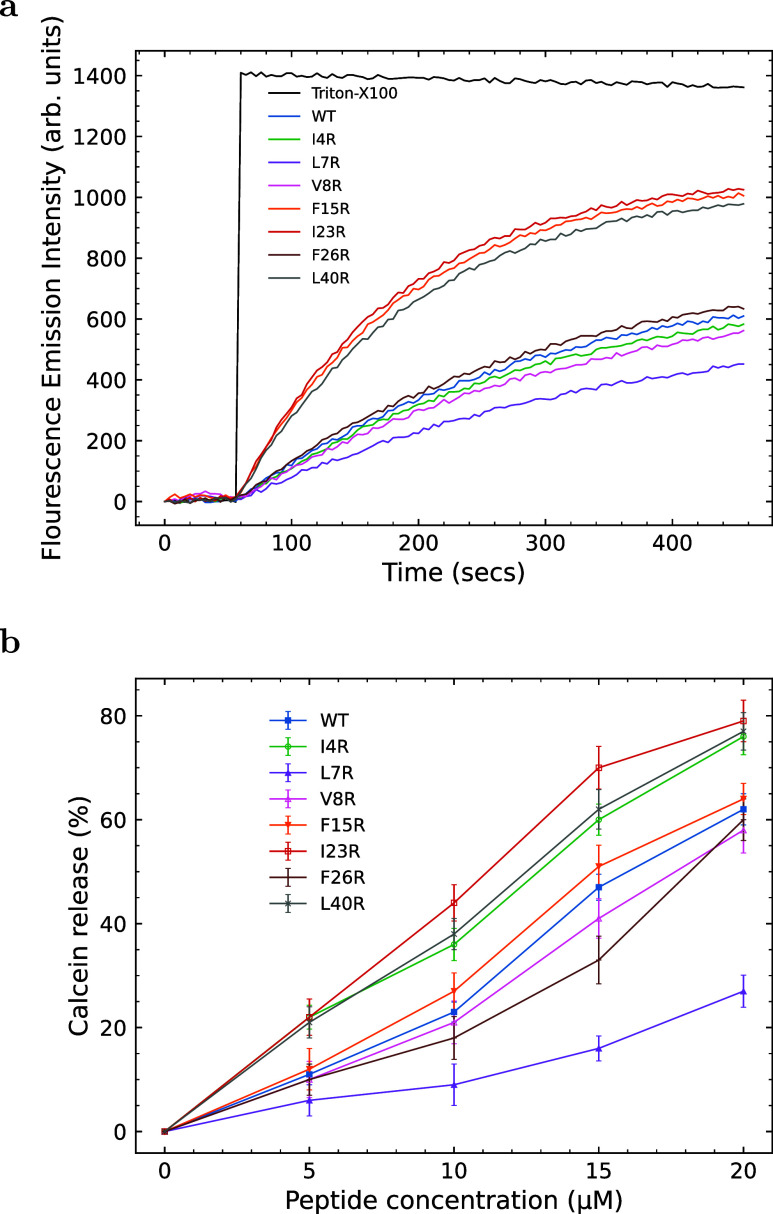
Figure 4.
(a) Release kinetics of calcein from 1:1 PG/PE liposomes (200 μM) as a function of time. At t = 50 s, either peptide (at a final concentration of 10 μM) or Triton-X100 (final concentration of 10% w/v) was added to each well and calcein release was measured with an excitation wavelength of 500 nm and an emission wavelength of 520 nm. (b) Percent release of calcein from 1:1 PG/PE liposomes (200 μM) as a function of peptide concentration. The 100% release level was determined using Triton-X detergent. Curves are the mean of three independent experiments with standard deviation error bars for WT (closed squares), I4R (open circles), L7R (closed triangles), V8R (open triangles), V8R (open triangles), F15R (closed inverted triangles), I23R (open squares), F26R (pluses), and L40R (crosses).

