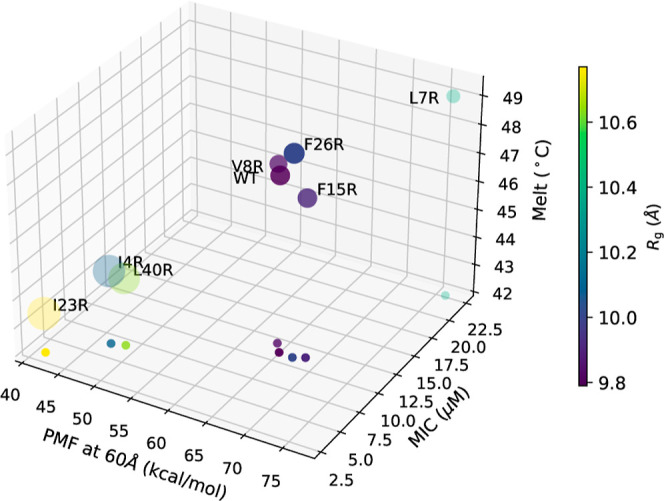
Figure 7.

Comparisons of WT and each mutant in terms of MIC, Tm, Rg, calcein release and PMF at 60 Å. The values of the PMF, MIC, and Tm are plotted along the x, y, and z axis, respectively, in a 3D rendering that is fully specified by the projection of the points onto the xy plane. In addition, the color of each data point represents the value of Rg as indicated on the color scale bar, and the size of the circle represents the relative magnitude of calcein release.
