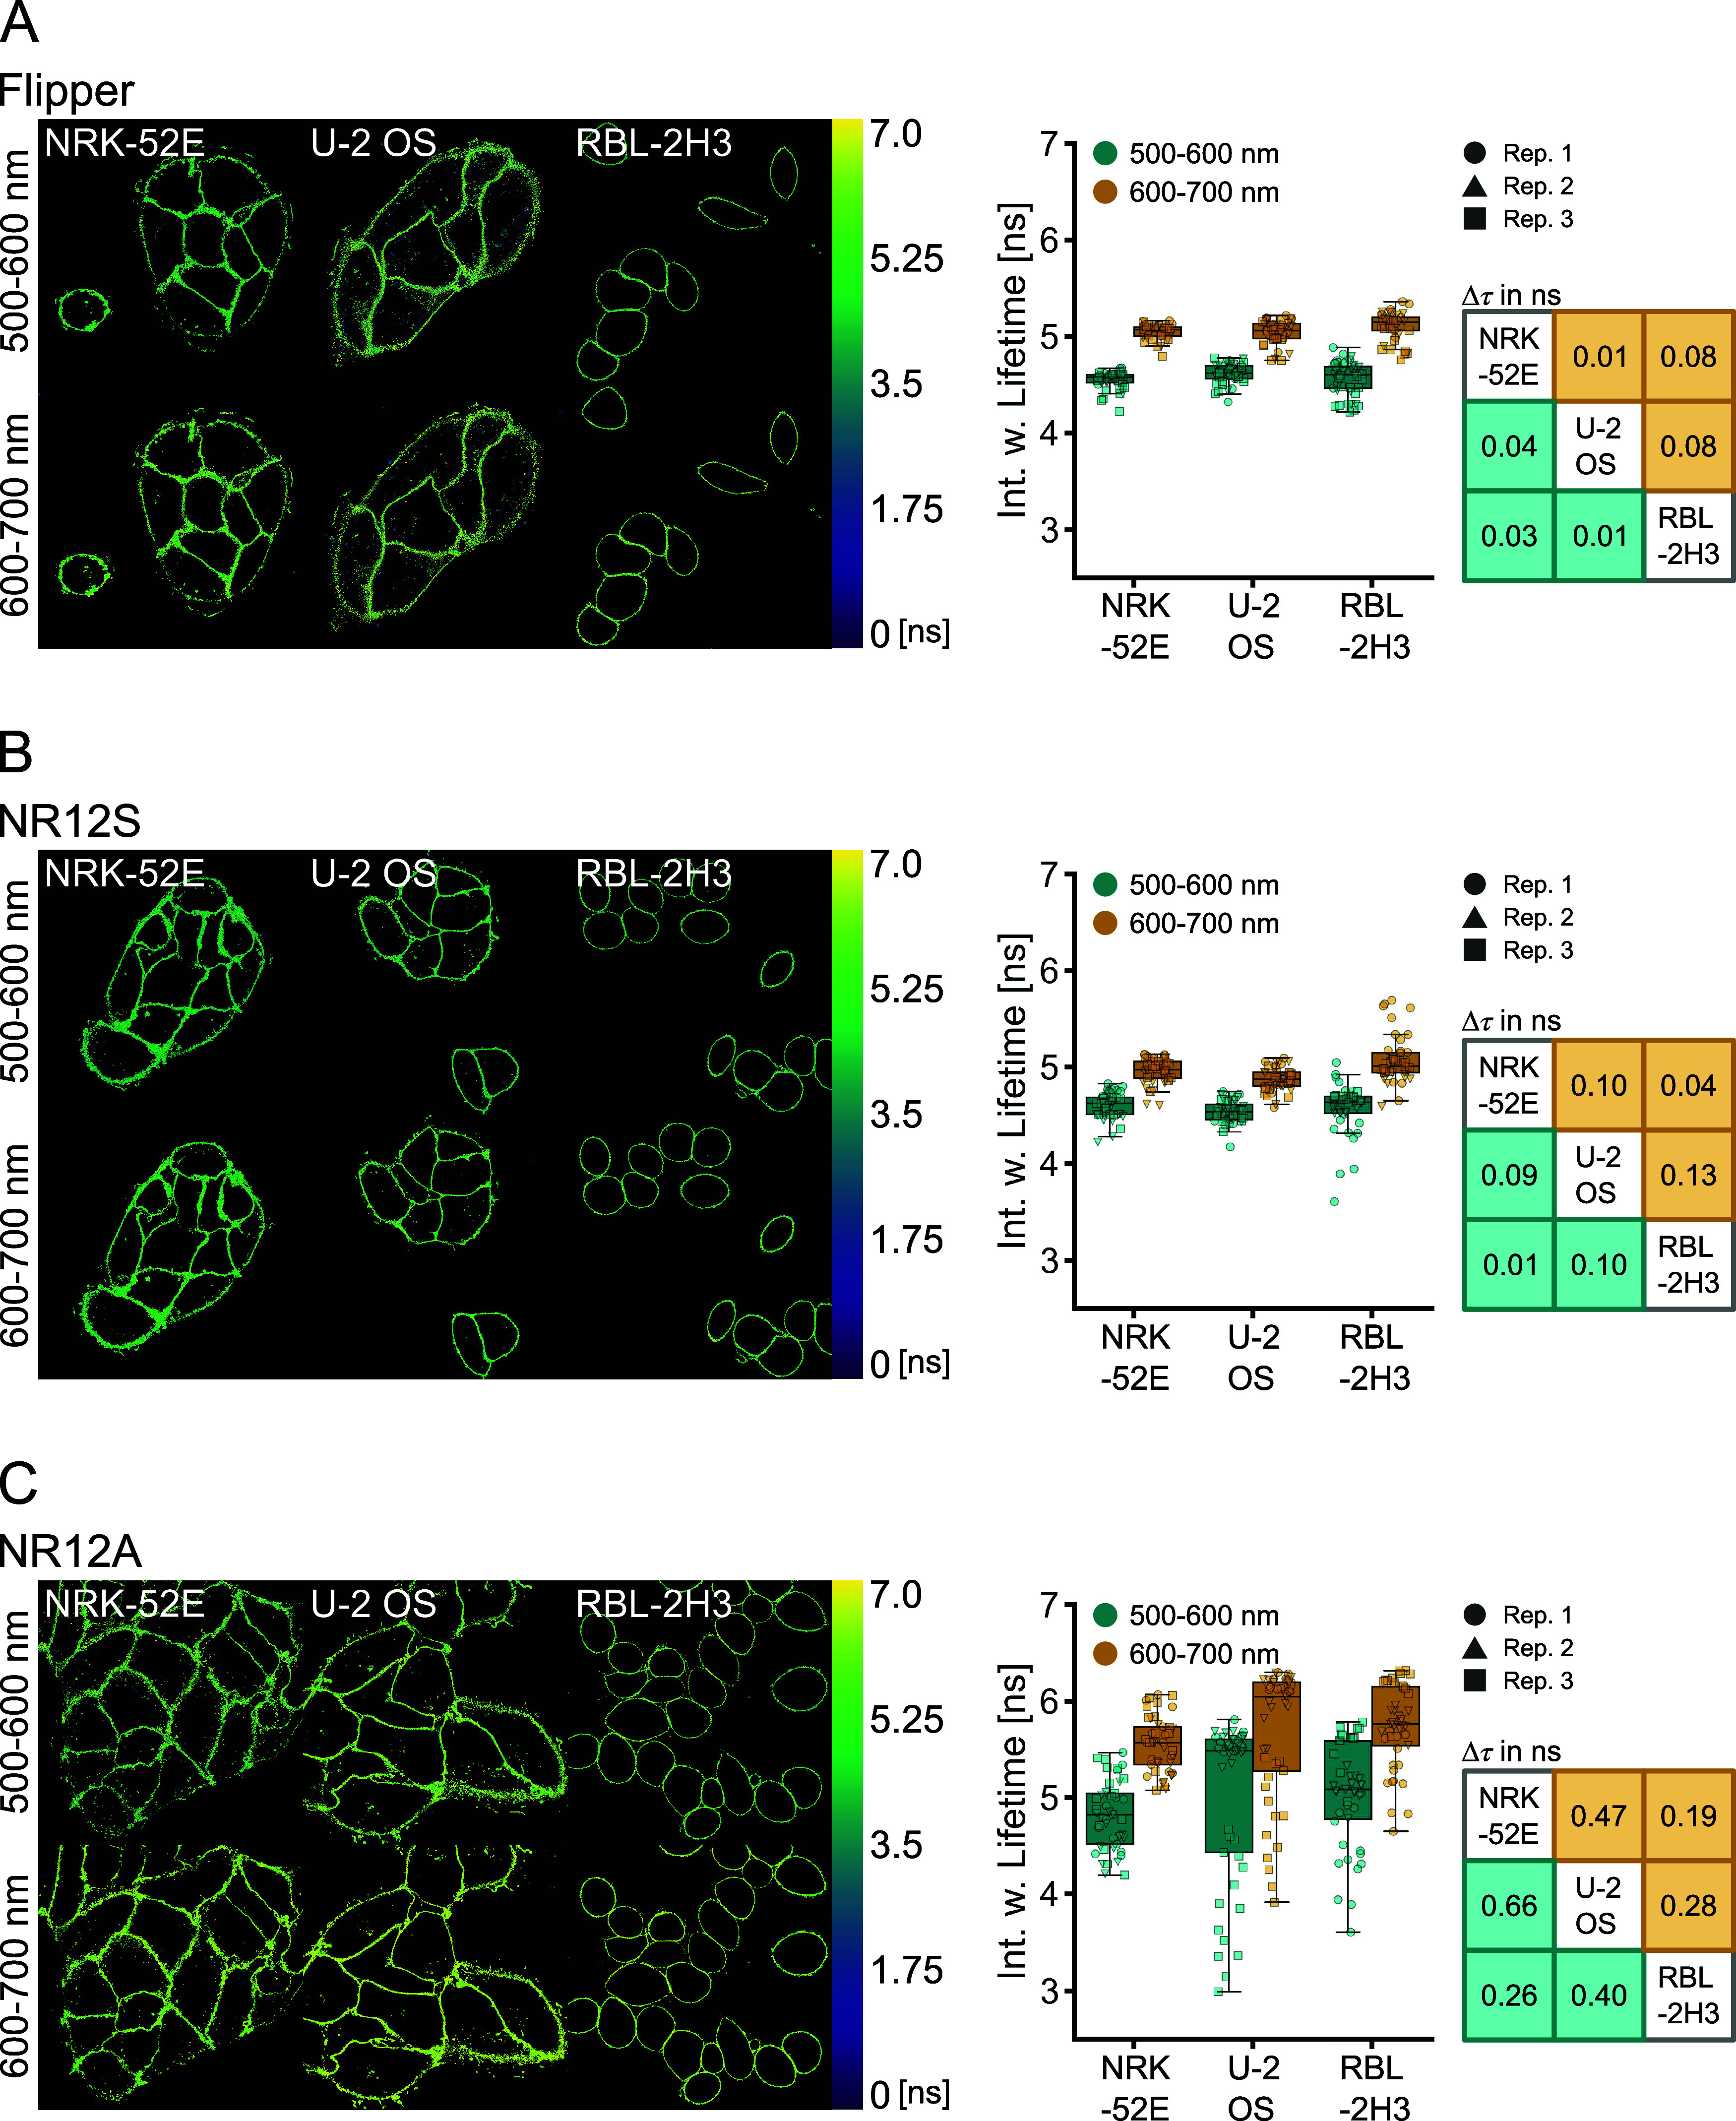
Figure 3.

Lifetimes of Flipper, NR12S, and NR12A in different cell types. Lifetime measurements of the probes in NRK-52E, U-2 OS, and RBL-2H3 cells were carried out at 500–600 and 600–700 nm emission windows. Multiexponential curve fitting was performed for the whole-image fluorescence decays. (A) Representative images of lifetime color-coded cells stained with Flipper and comparison of the intensity-weighted lifetime in different cell types and at different emission wavelengths. (B) Representative images of lifetime color-coded cells stained with NR12S and comparison of the intensity-weighted lifetime in different cell types and at different emission wavelengths. (C) Representative images of lifetime color-coded cells stained with NR12A and comparison of the intensity-weighted lifetime in different cell types and at different emission wavelengths. Different symbols correspond to images of individual biological replicates (n = 3). Tables indicate Δτ values of the medians between the cell types in the two channels.
