
Figure 4.
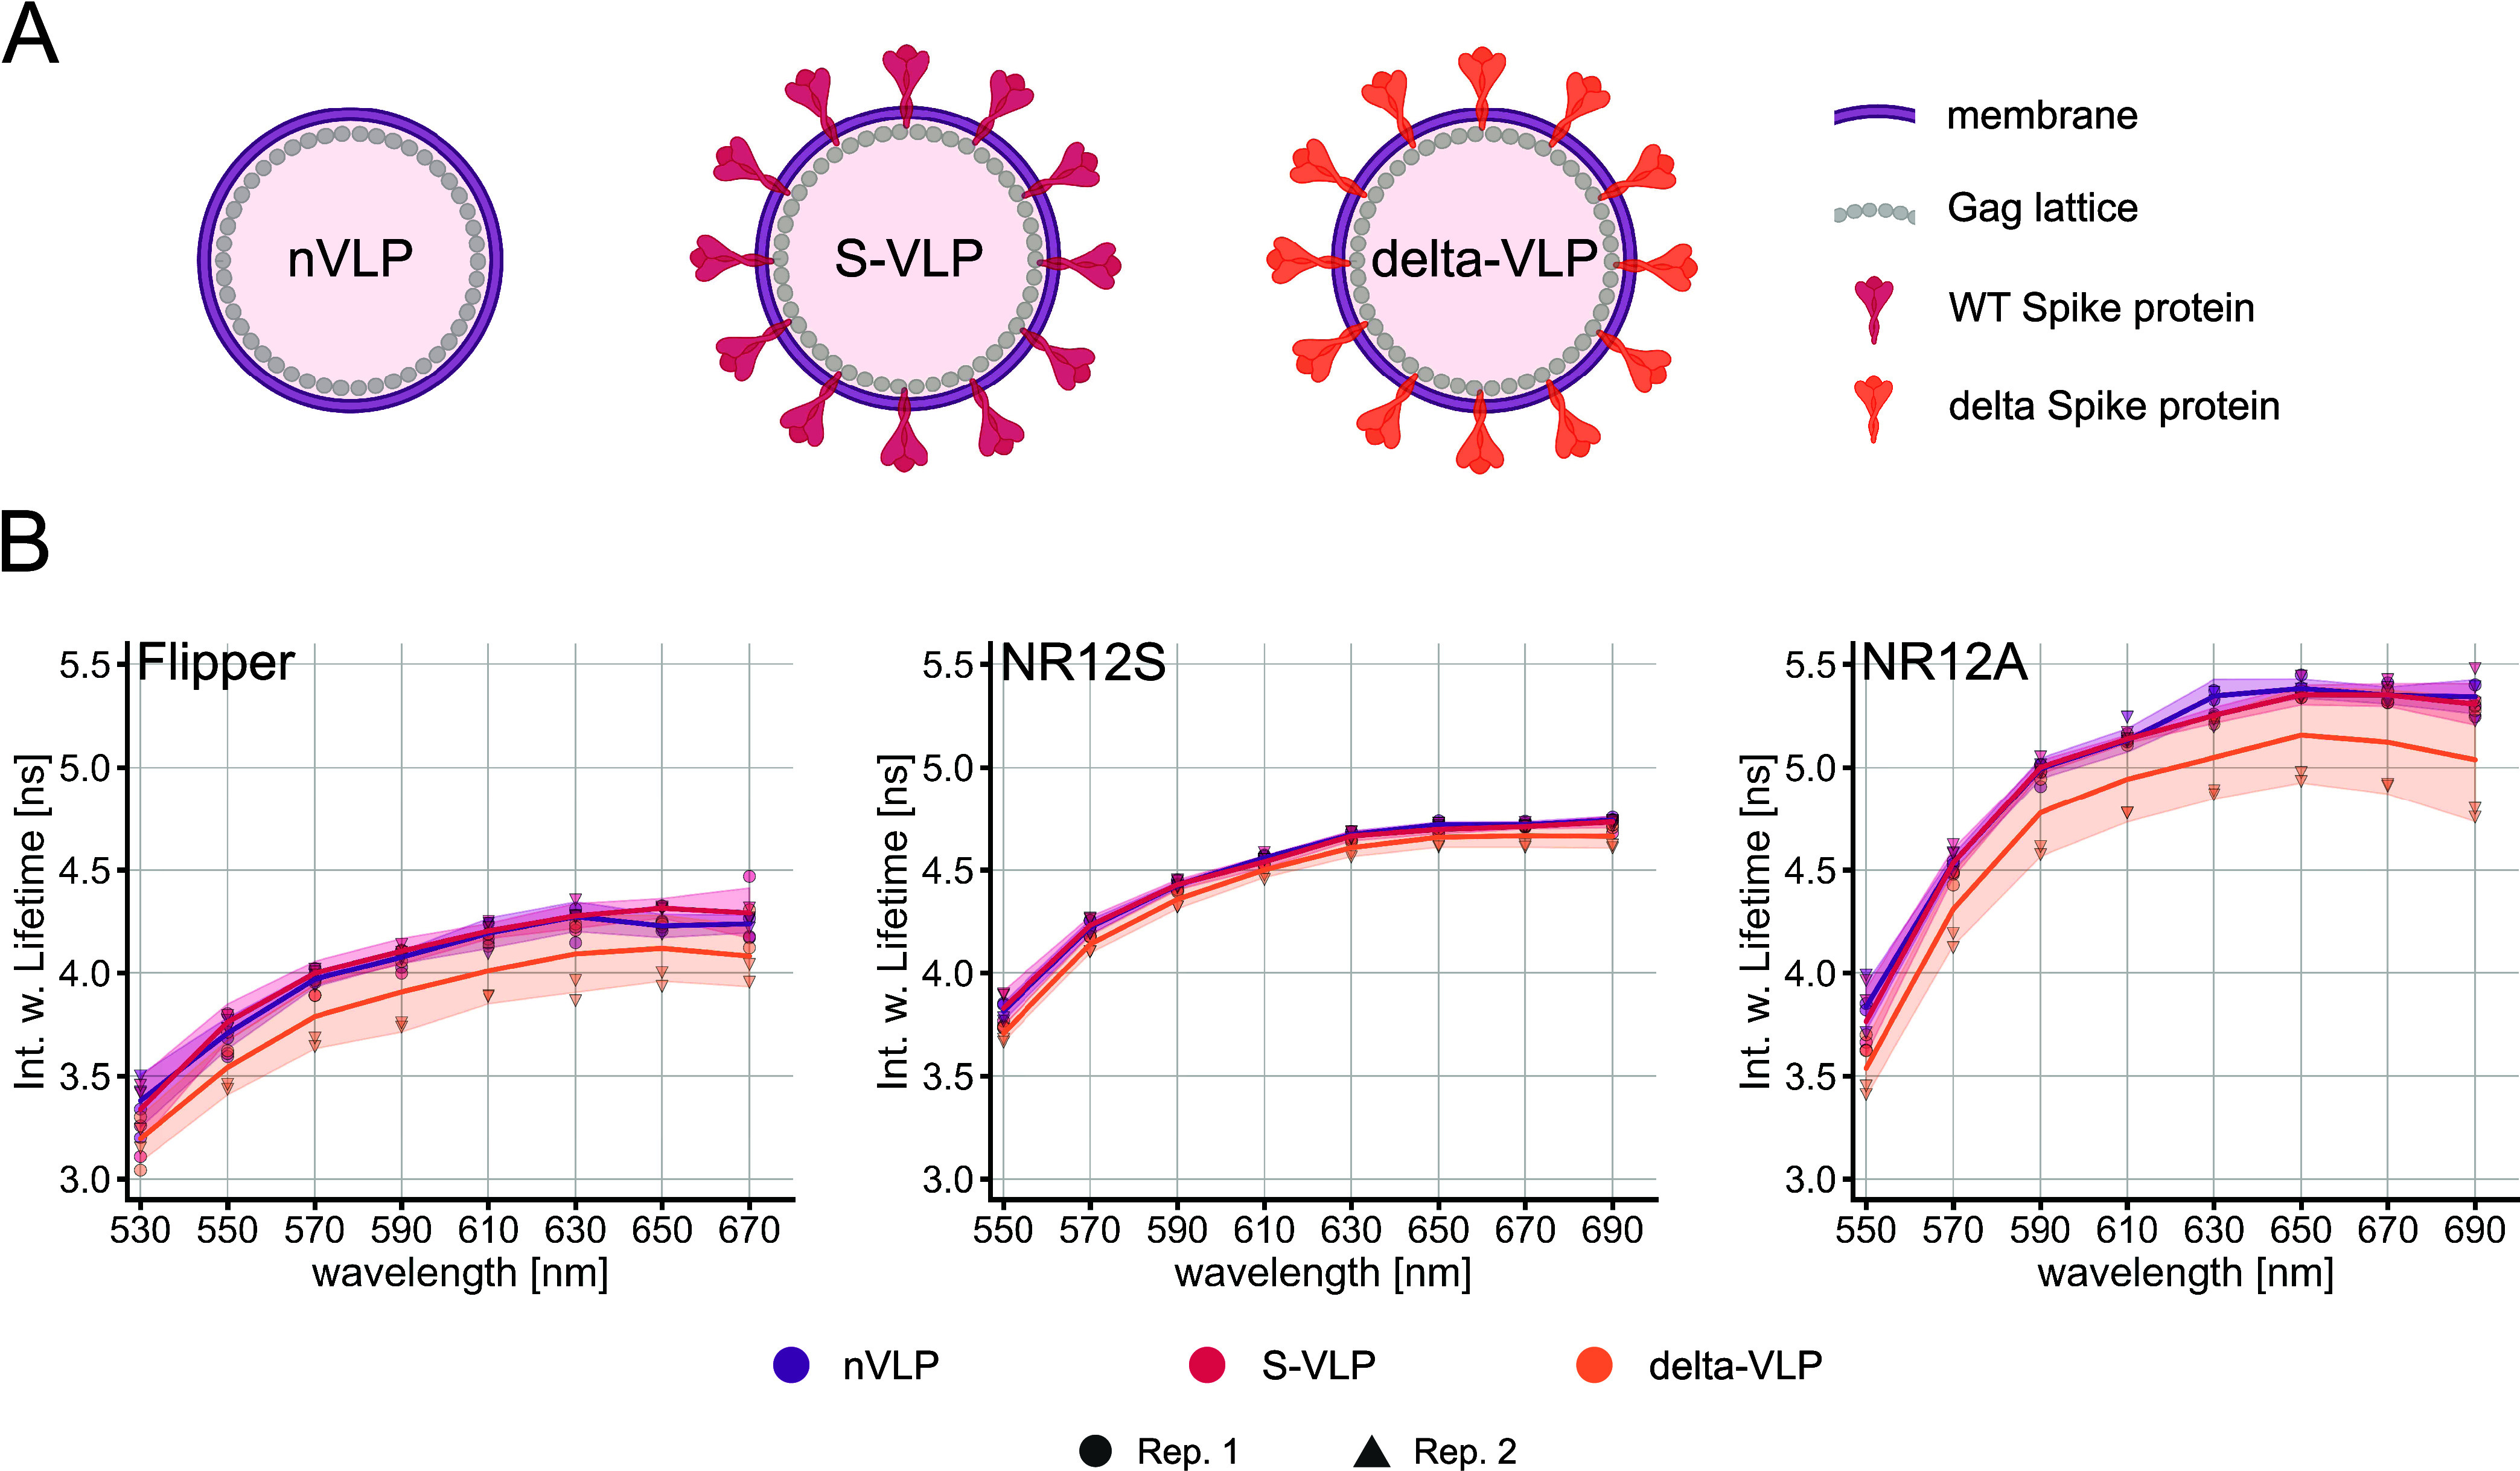
Lifetimes of Flipper, NR12S, and NR12A in different VLP species. (A) Schematic representation of the SARS-CoV-2 n-VLPs, S-VLPs, or delta-VLPs (created with Biorender.com). (B) Spectral fluorescence lifetime measurements of the probes in the VLPs were carried out within 500–700 nm in intervals of 20 nm. Multiexponential curve fitting was performed for the fluorescence decays. Spectrally resolved intensity-weighted lifetime of Flipper (left), NR12S (middle), and NR12A (right) in different VLP species. The line corresponds to the median of individual biological replicates shown with different symbols (n = 2). The band corresponds to standard deviation.