
Figure 5.
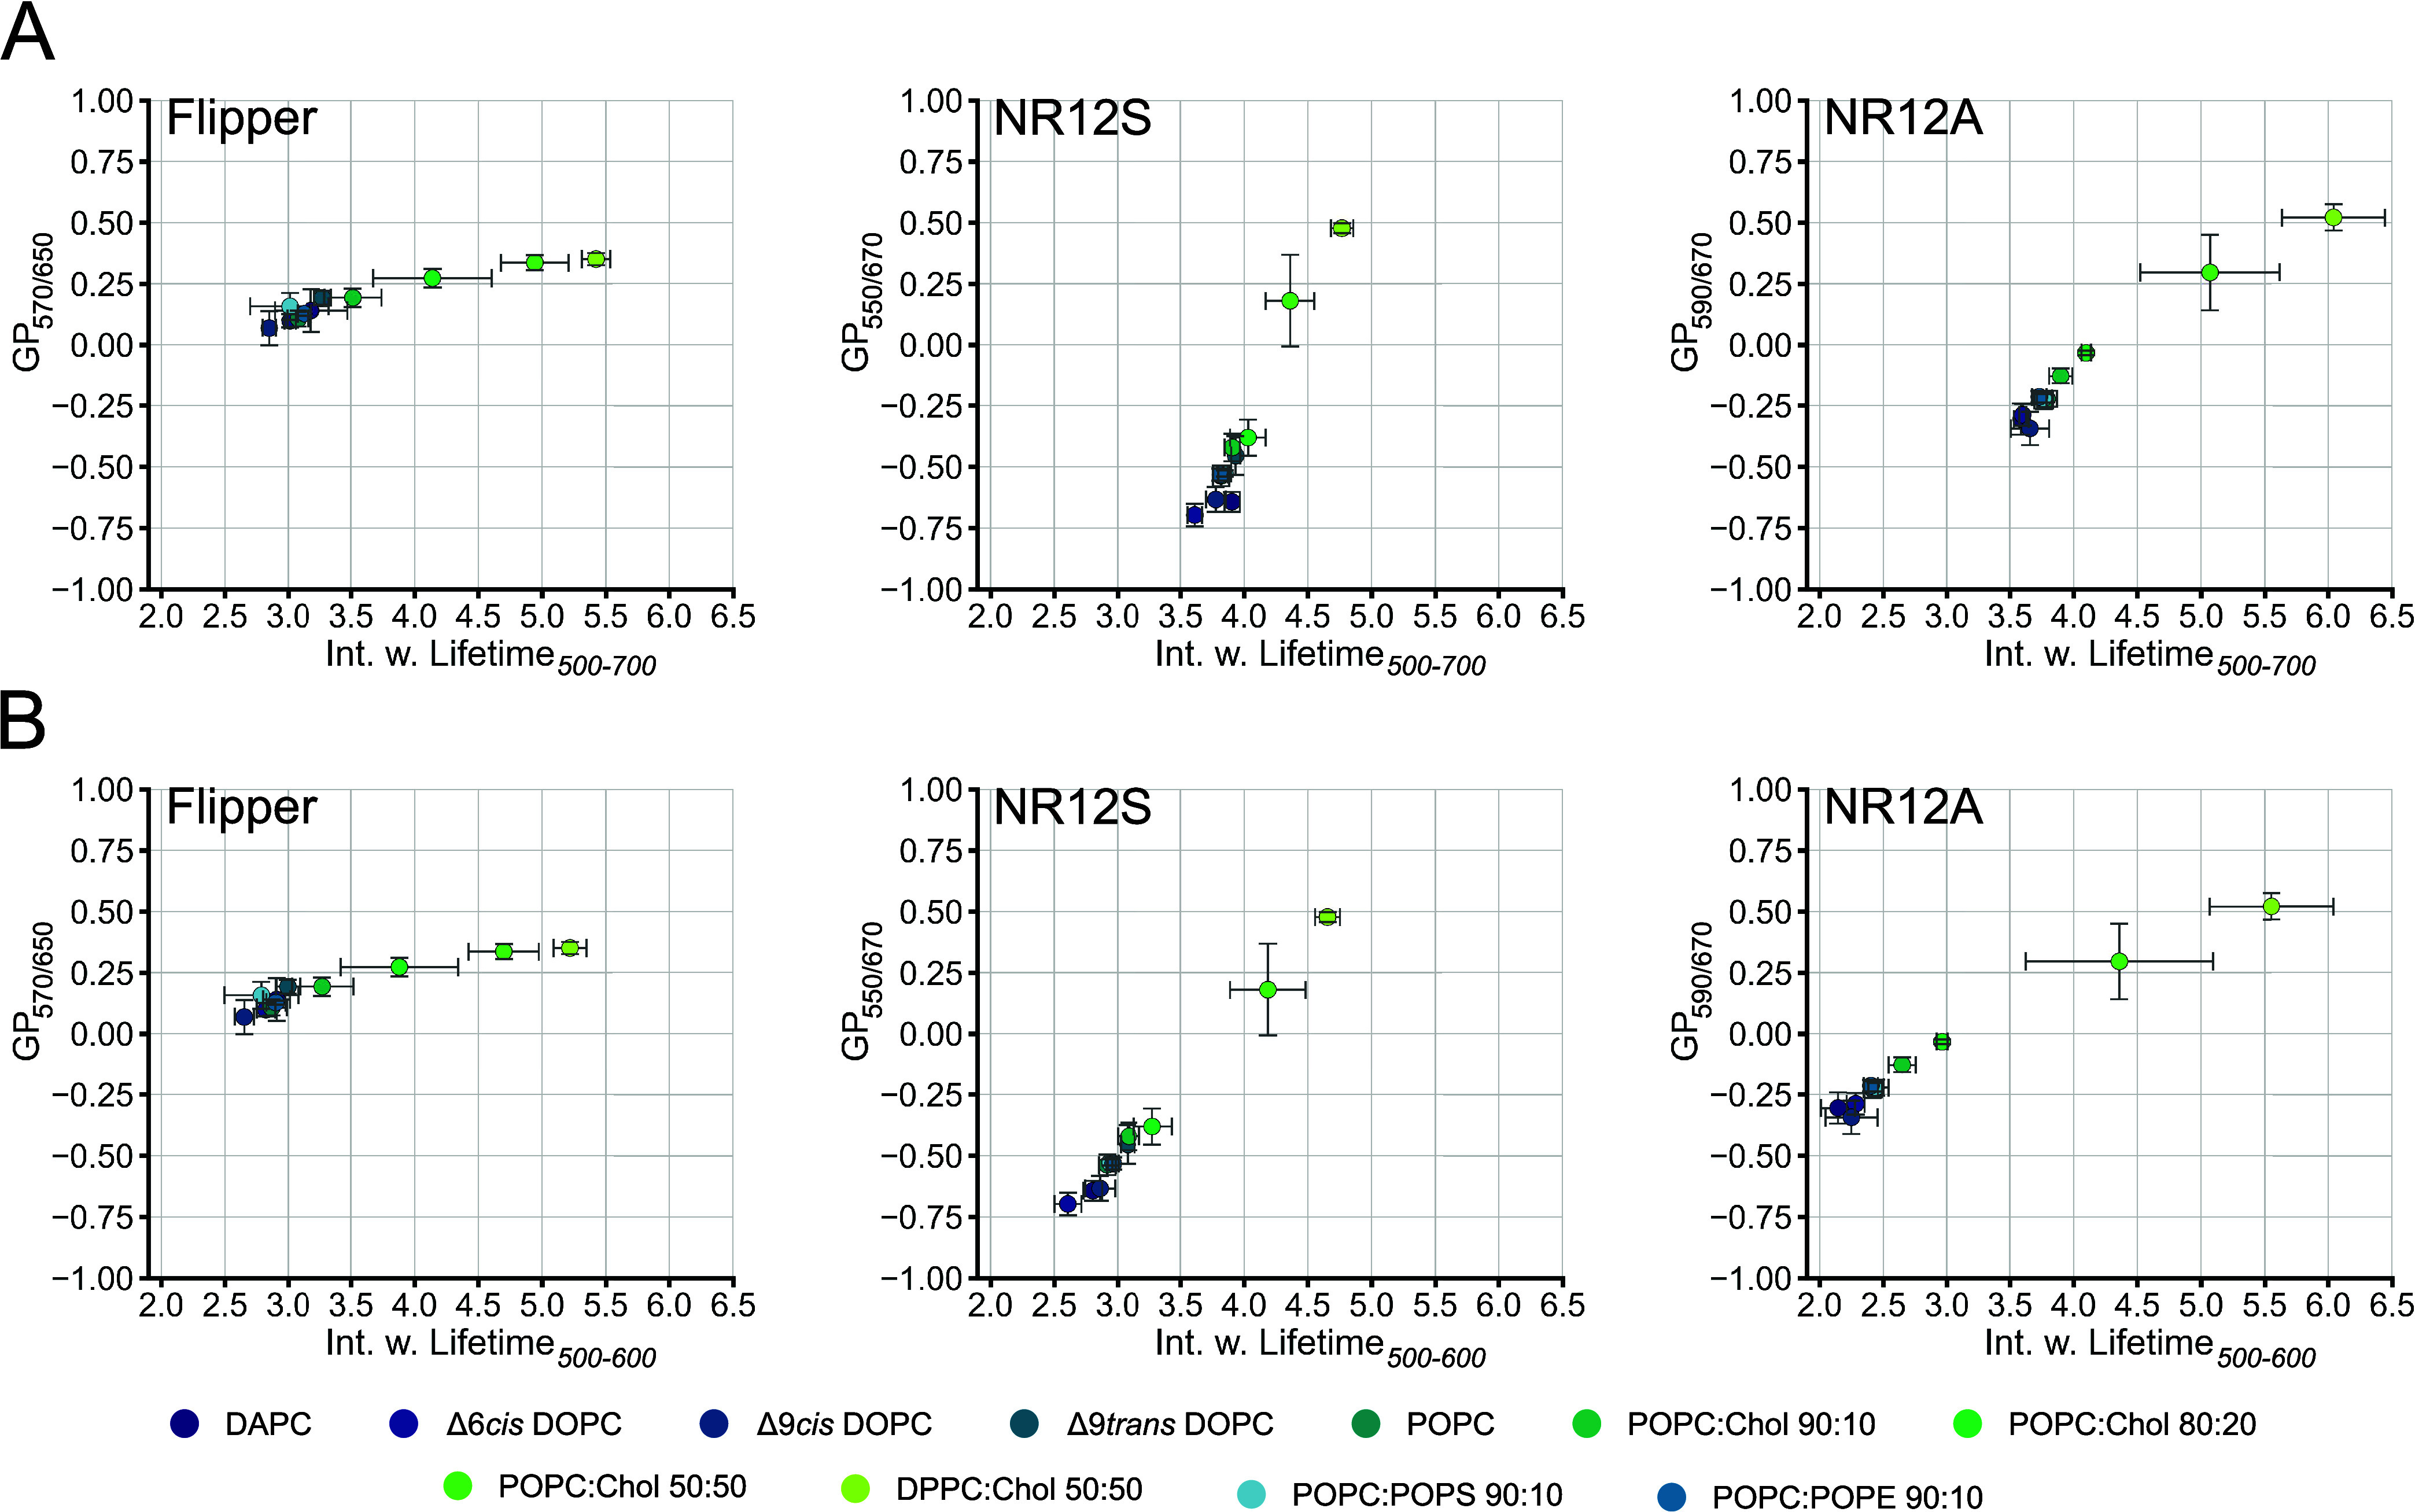
GP vs lifetime from Flipper, NR12S, and NR12A in different lipid environments. Spectral fluorescence lifetime measurements of the probes in LUVs were carried out within 500–700 nm in intervals of 20 nm. Multiexponential curve fitting was performed for the fluorescence decays within (A) 500–700 nm or (B) 500–600 nm wavelength ranges. Comparison of resolution power of Flipper (left), NR12S (middle), and NR12A (right) in intensity-based GP analysis vs lifetime analysis in different lipid environments. Dots correspond to the median GP of the respective wavelengths and median mean intensity-weighted lifetime. Error bars correspond to the standard deviation. GP and lifetime analysis was performed using the same dataset.