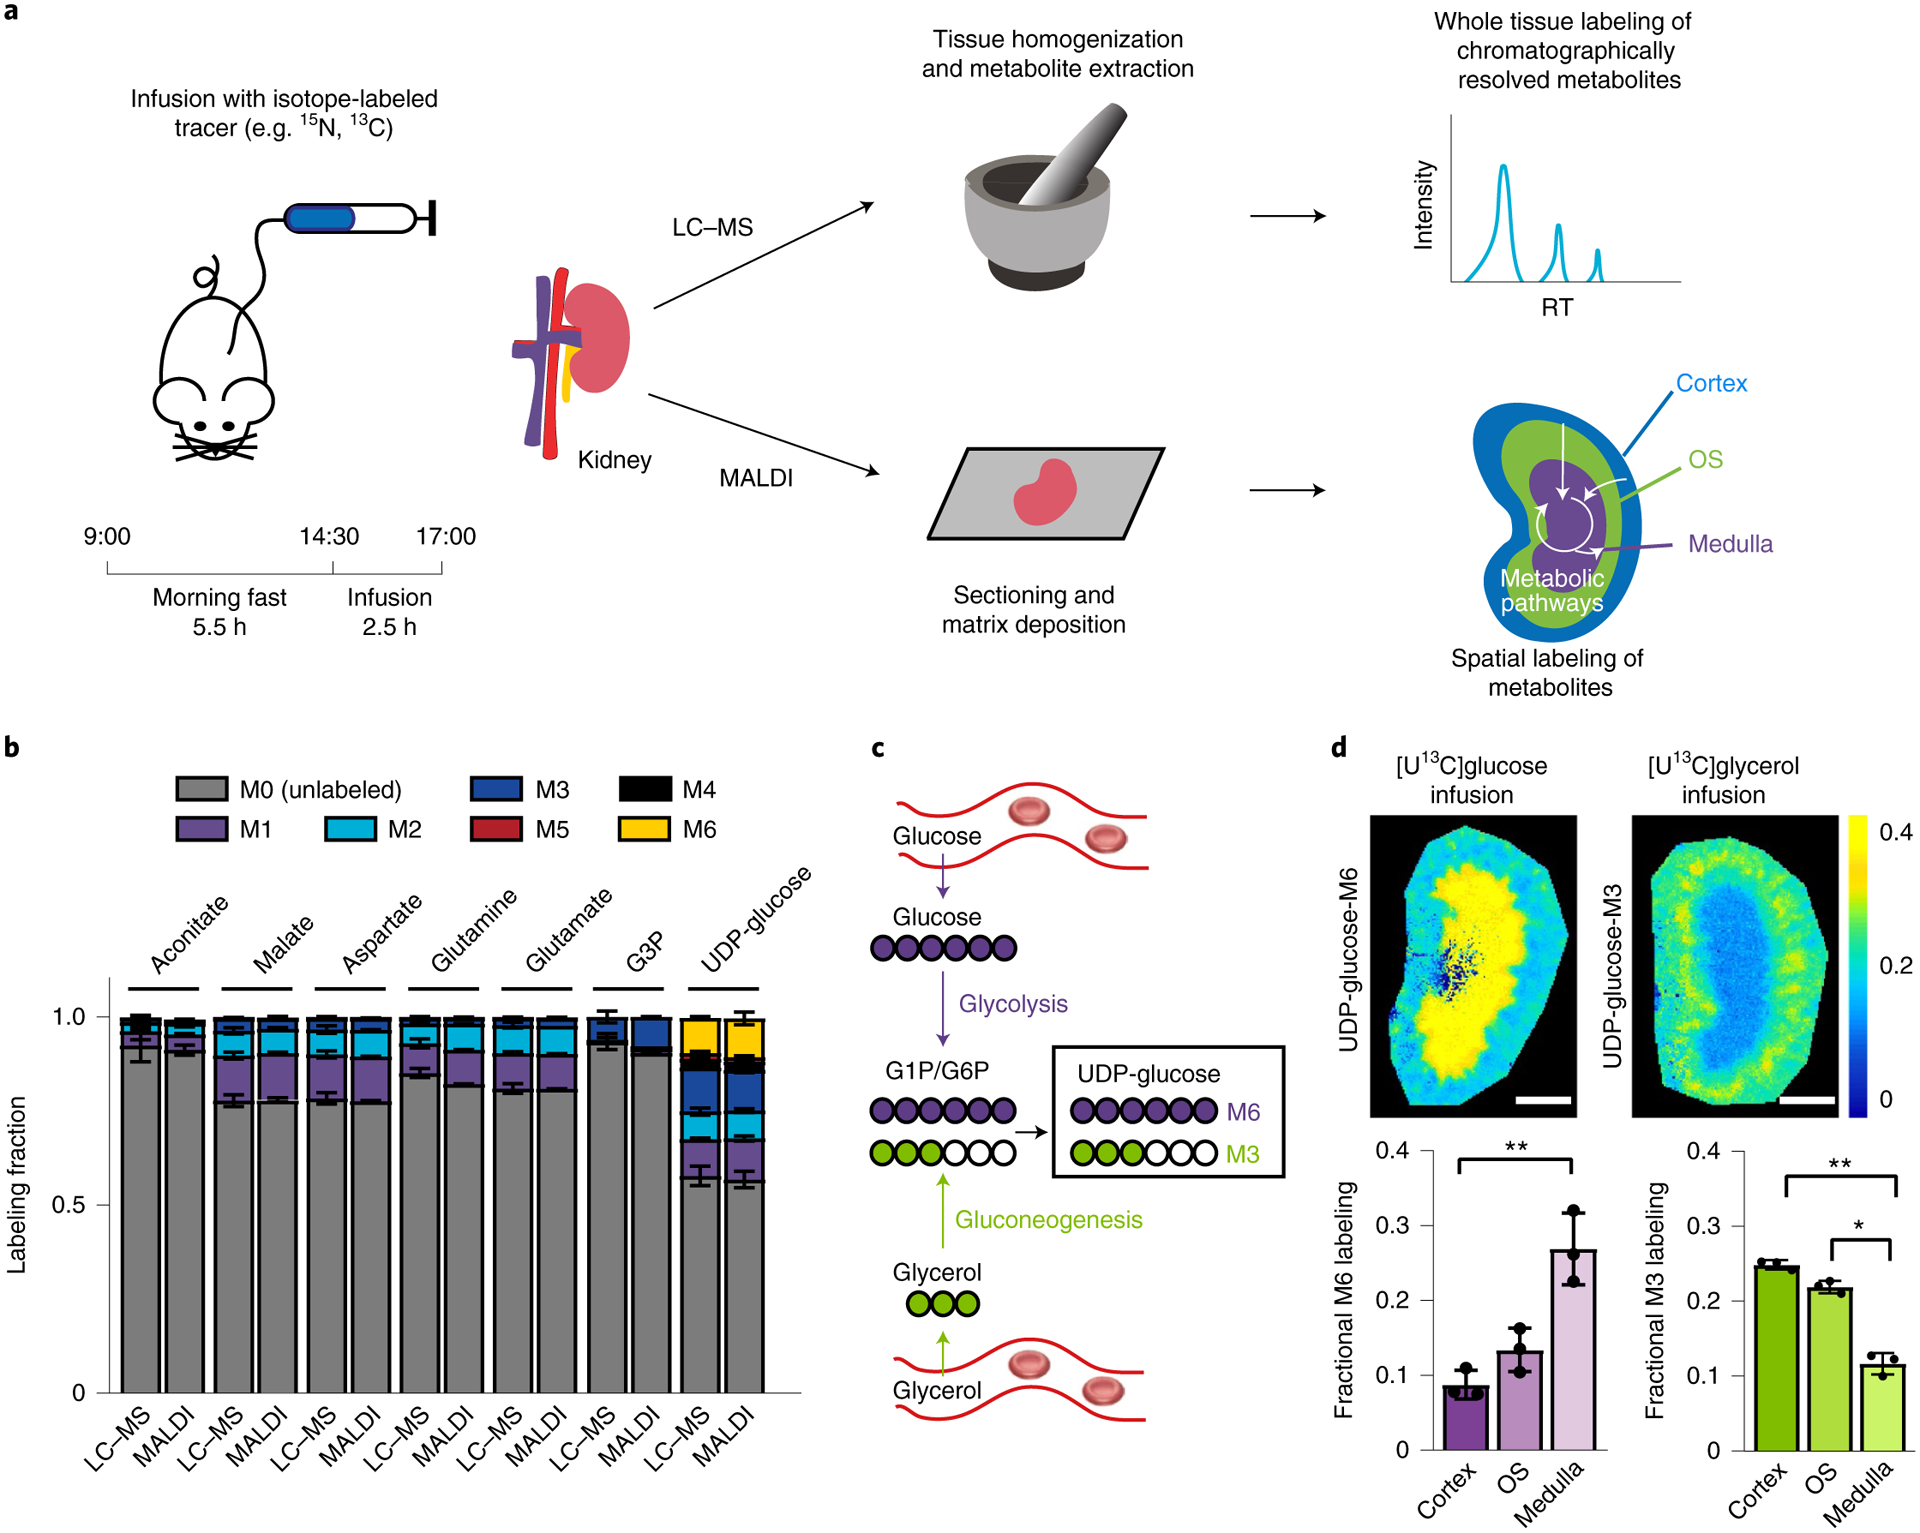
Fig. 1 |. Iso-imaging workflow and spatial distribution of glycolytic and gluconeogenic activity in the kidney.

a, Illustration of the infusion of stable-isotope-labeled nutrients coupled to LC–MS (top) or iso-imaging (bottom). OS, outer stripe; RT, retention time. b, Quantitation ions for iso-imaging were selected based on their showing matching isotope labeling by MALDI imaging and LC–MS. c, Schematic of metabolic pathways to UDP-glucose from infused [U-13C]glucose or [U-13C]glycerol. d, UDP-glucose labeling in murine kidney from [U-13C]glucose infusion (M6 isotopolog of UDP-glucose) and [U-13C]glycerol (M3 isotopolog of UDP-glucose) infusion. Colors reflect the labeled fraction of the indicated isotope form of UDP-glucose (spatially resolved in the kidney), normalized to the enrichment of the same isotopic form of the infused tracer in serum. Scale bars, 1 mm. Bar graphs are mean ± s.d. n = 3. *P < 0.05; **P < 0.001, by unpaired two-sided Student’s t-test with Welch’s correction for unequal variances. exact P values are provided in the Source Data.
