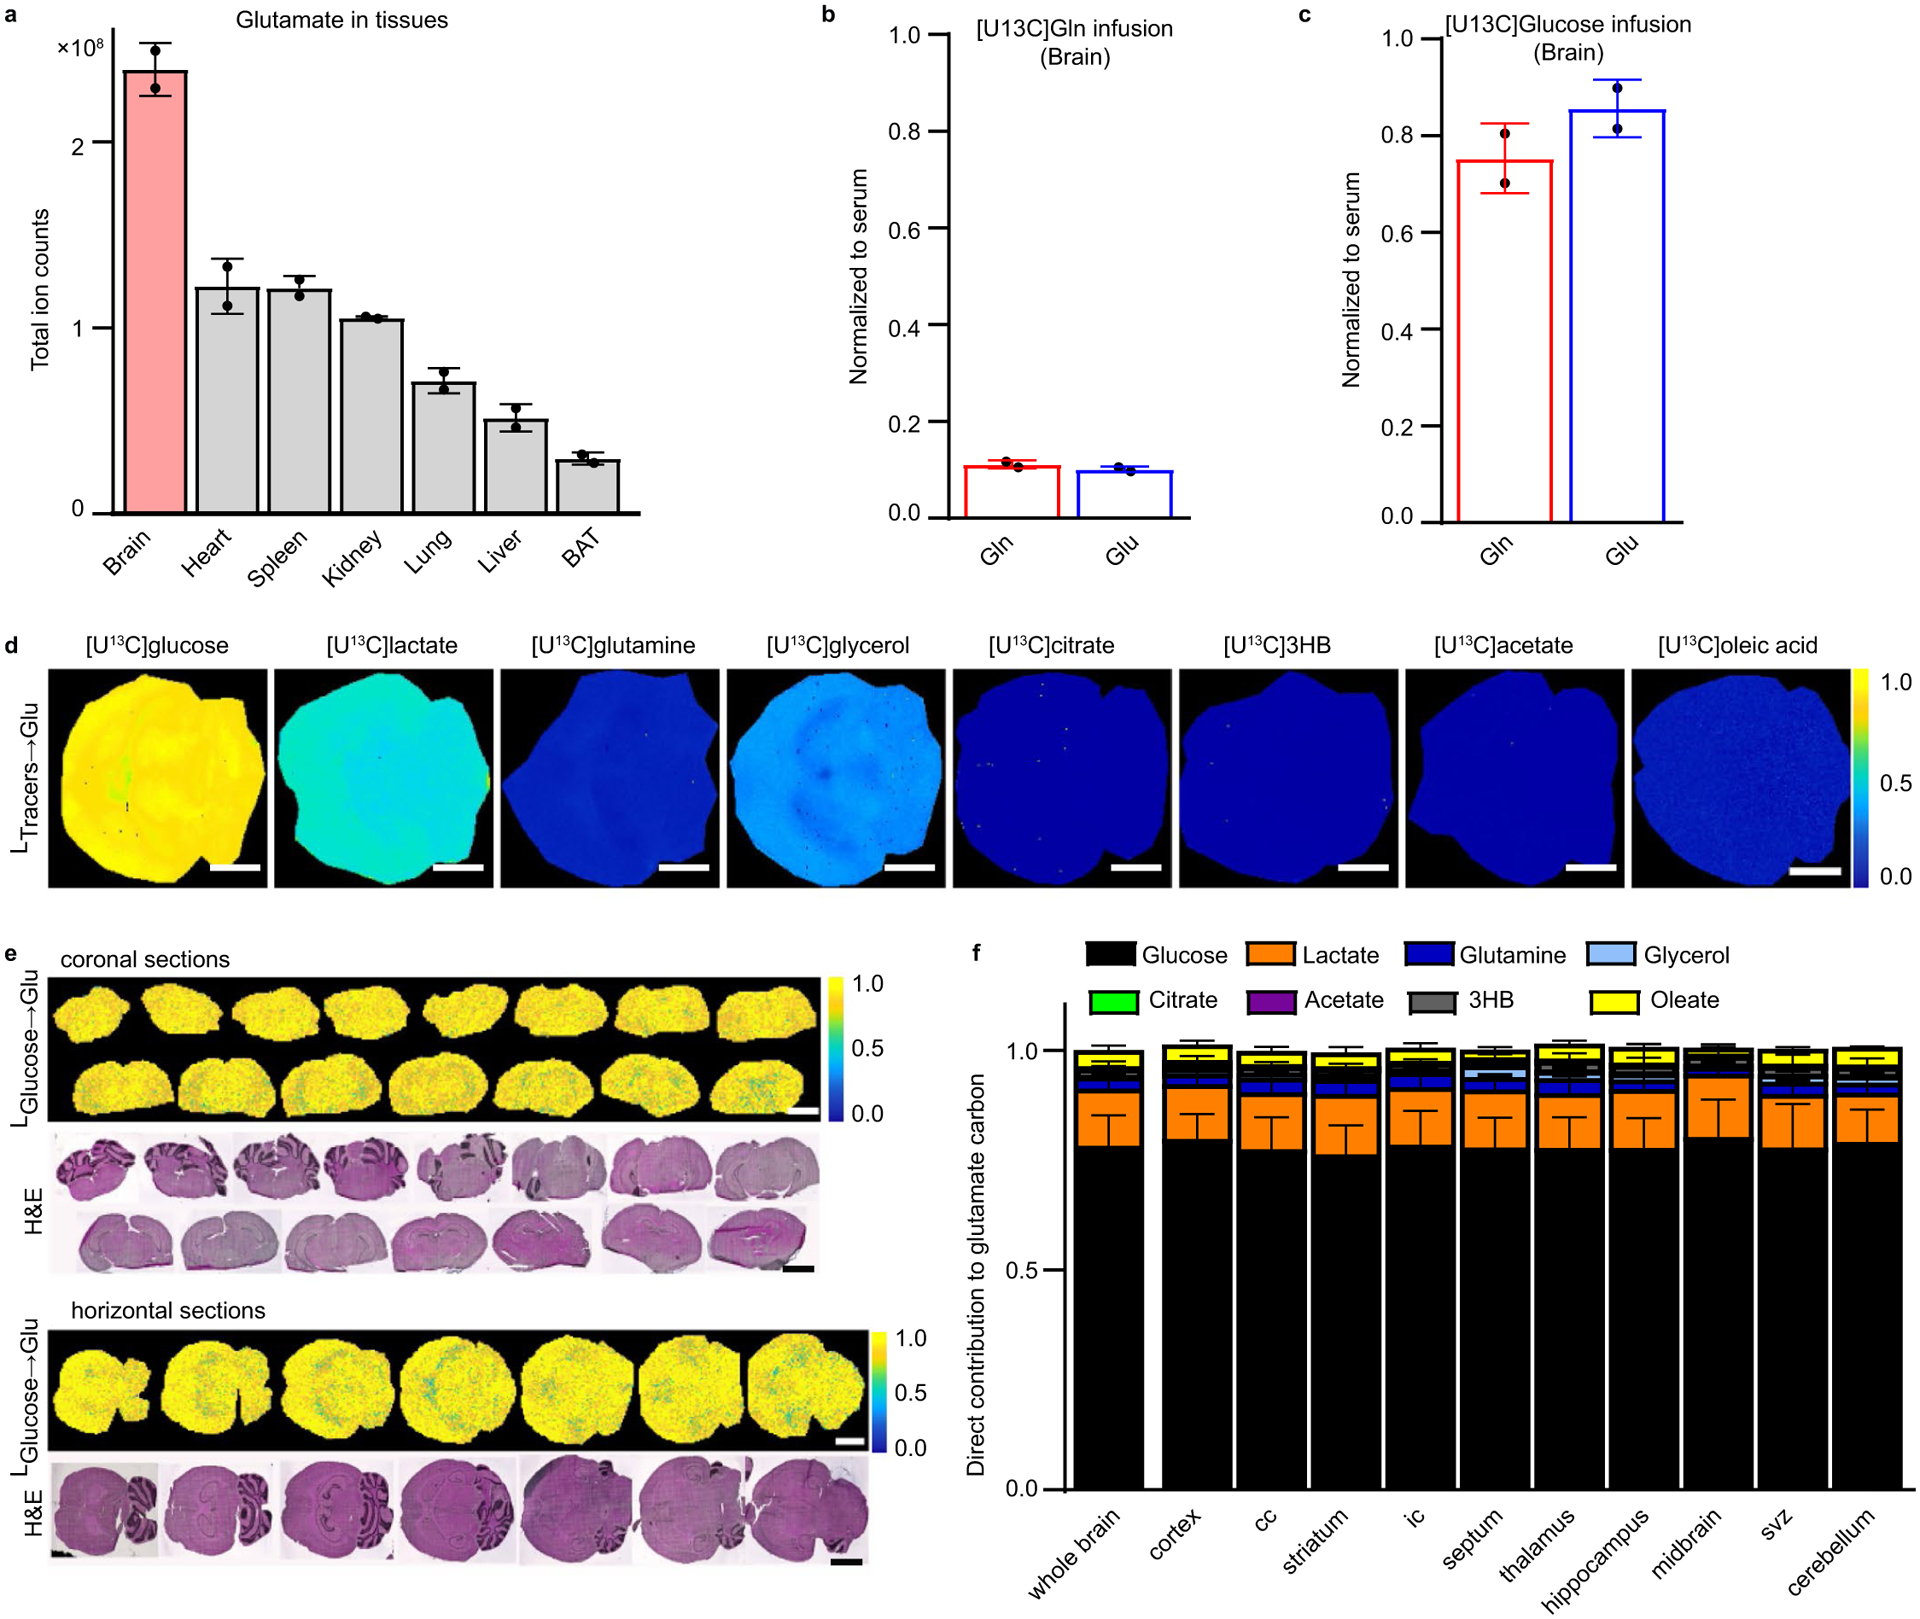
Extended Data Fig. 6 |. Glutamate levels in different organs and fractional contribution of carbon-labeled substrates to glutamate in mice fed normal or ketogenic diet.

a. Relative glutamate levels in organs of the mouse. n = 2. (BAT = brown adipose tissue). b. Average carbon atom labeling of glutamine and glutamate in the brain normalized to serum after [U-13C]glutamine infusion. n = 2. c. Average carbon labeling of glutamine and glutamate in the brain normalized to serum after [U-13C]glucose infusion. n = 2. d. Iso-imaging of glutamate labeling in the murine brain from the indicated U-13C-tracers. Colors reflect the average carbon atom labeling of glutamate spatially resolved in the brain ( where n = 5 as glutamate has five carbons, and Mi is the ratio of glutamate’s M + i form) normalized to the average carbon atom labeling of the infused tracer in serum. e. Horizontal and coronal sections of the murine brain showing homogeneous normalized labeling of glutamate by [U-13C]glucose throughout the entire organ. f. Direct carbon contributions to glutamate in different regions of the murine brain. Calculated from data in Fig. 4c and extended Data Fig. 5d. Scale bar: 700 μm, Data are mean + /− s.d. n = 3 for all experiments unless otherwise indicated.
