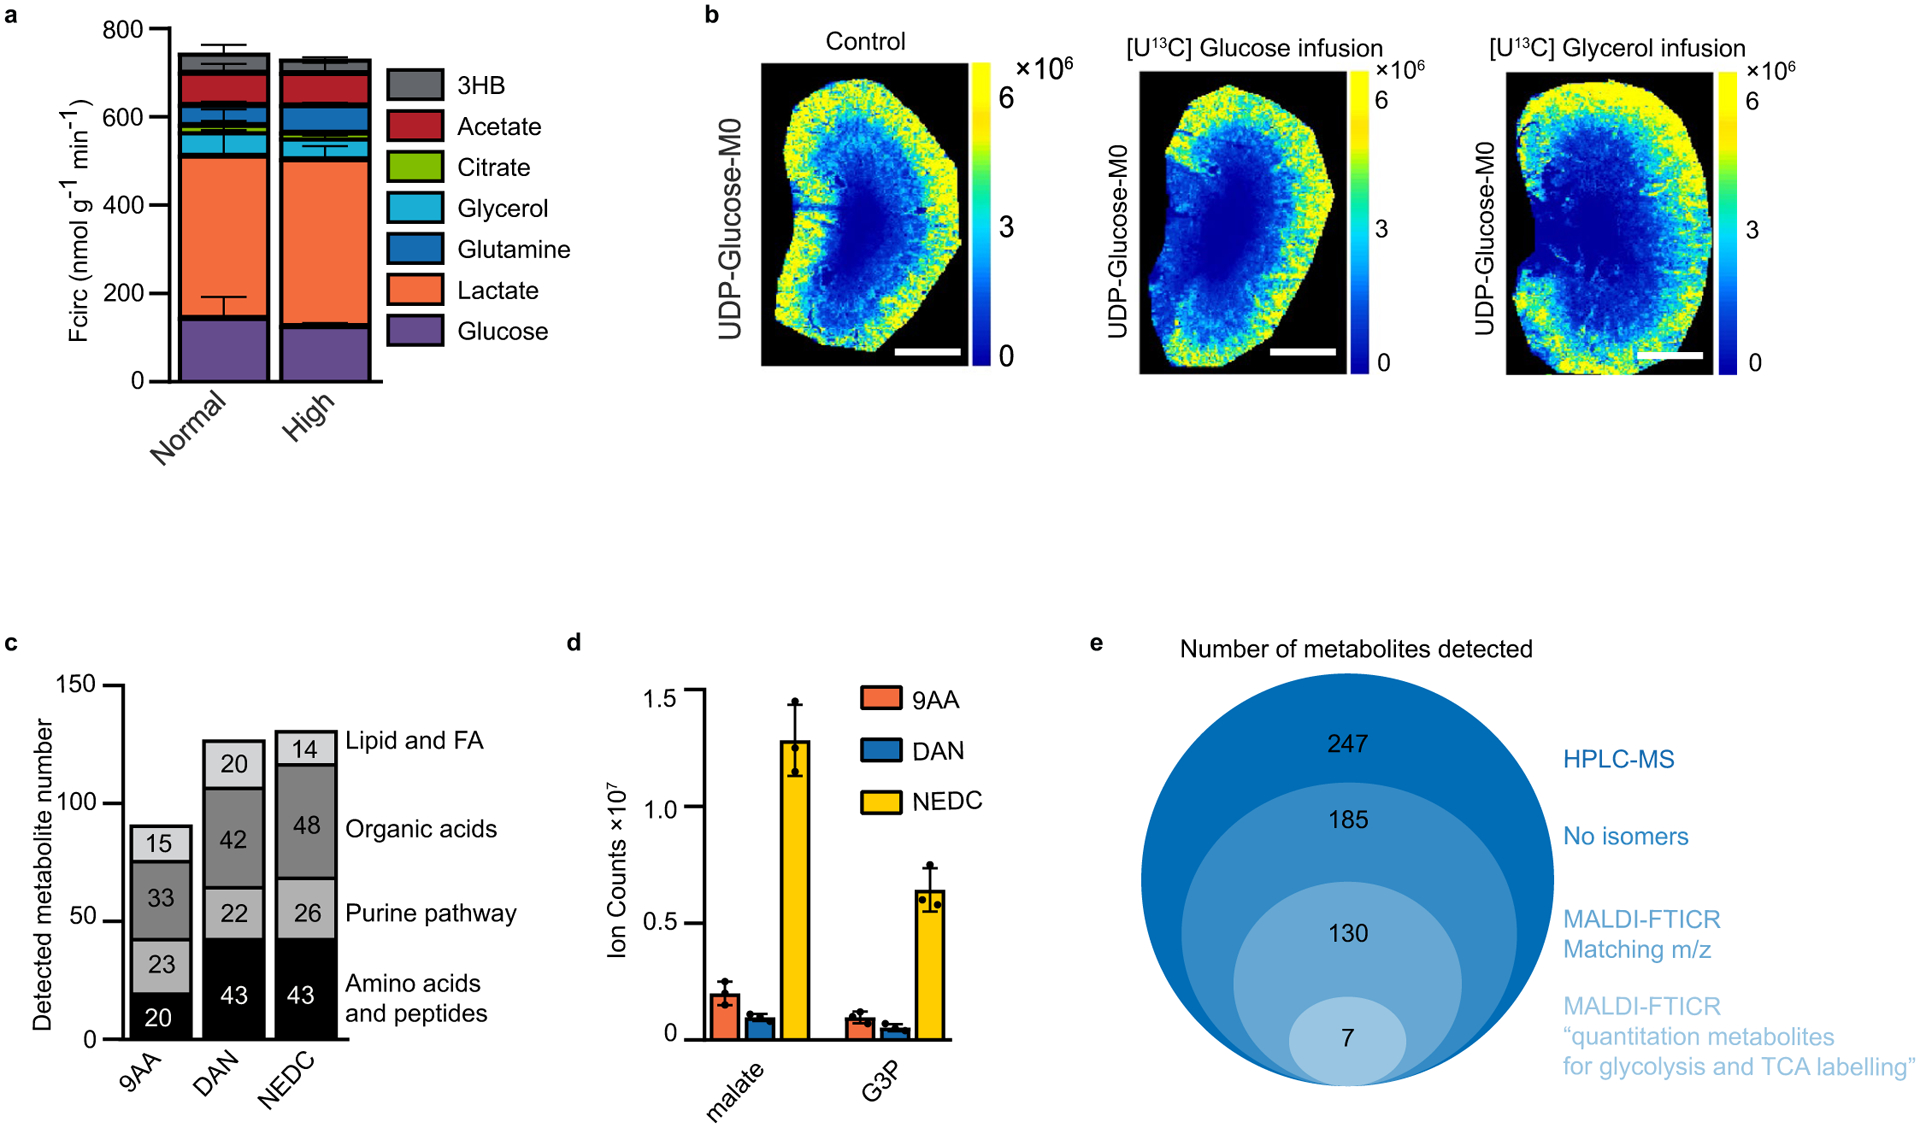
Extended Data Fig. 1 |. Iso-imaging pipeline, quantitation ions and control experiments.

a. Quantification of the circulatory turnover flux (Fcirc) at minimally perturbative infusion rates previously employed1 and somewhat higher infusion rates employed here to enable more facile measurement of downstream metabolite labeling (Supplementary Table 1). Note that the modestly higher infusion rates do not substantially perturb endogenous metabolic fluxes. b. Imaging mass spectrometry of UDP-glucose unlabeled signal intensity (M0) in control kidneys, after [U-13C]glucose infusion and after [U-13C]glycerol infusion. Note that the infusions are minimally perturbative, that is they do not alter UDP-glucose’s spatial distribution or signal intensity. c. Number of metabolites of different classes detected by MALDI–MSI using three different matrices (9-AA: 9-aminoacridine, 1,5-DAN: diaminonaphthalene, NeDC: N-(1-naphthyl) ethylenediamine) in negative ionization mode. d. Ion intensities of malate and glycerol-3-phosphate by MALDI–MSI with the indicated matrix in negative ionization mode. e. Steps used to select the quantitation metabolites for iso-imaging. 247 water soluble metabolites were readily quantified by HPLC-MS in negative mode (HPLC-MS). These were the initial candidates. Among these, 185 metabolites were observed as single LC–MS peaks without obvious isomers (‘no isomers’). Using NeDC as the matrix, 130 ions aligning with these metabolites were detected using MALDI-FTICR in negative ionization mode (MALDI-NeDC). Of these, seven metabolites showed similar isotope labeling patterns by LC–MS and MALDI (matching labeling patterns, ‘Quantitation metabolites’) from U13C-glucose infusion. Scale bars: 1 mm. n = 3 for all experiments unless otherwise indicated. Data presented as mean + /− s.d.
