
Extended Data Fig. 4 |. Direct contributions to malate and TCA-associated amino acids in murine kidney cortex and medulla.
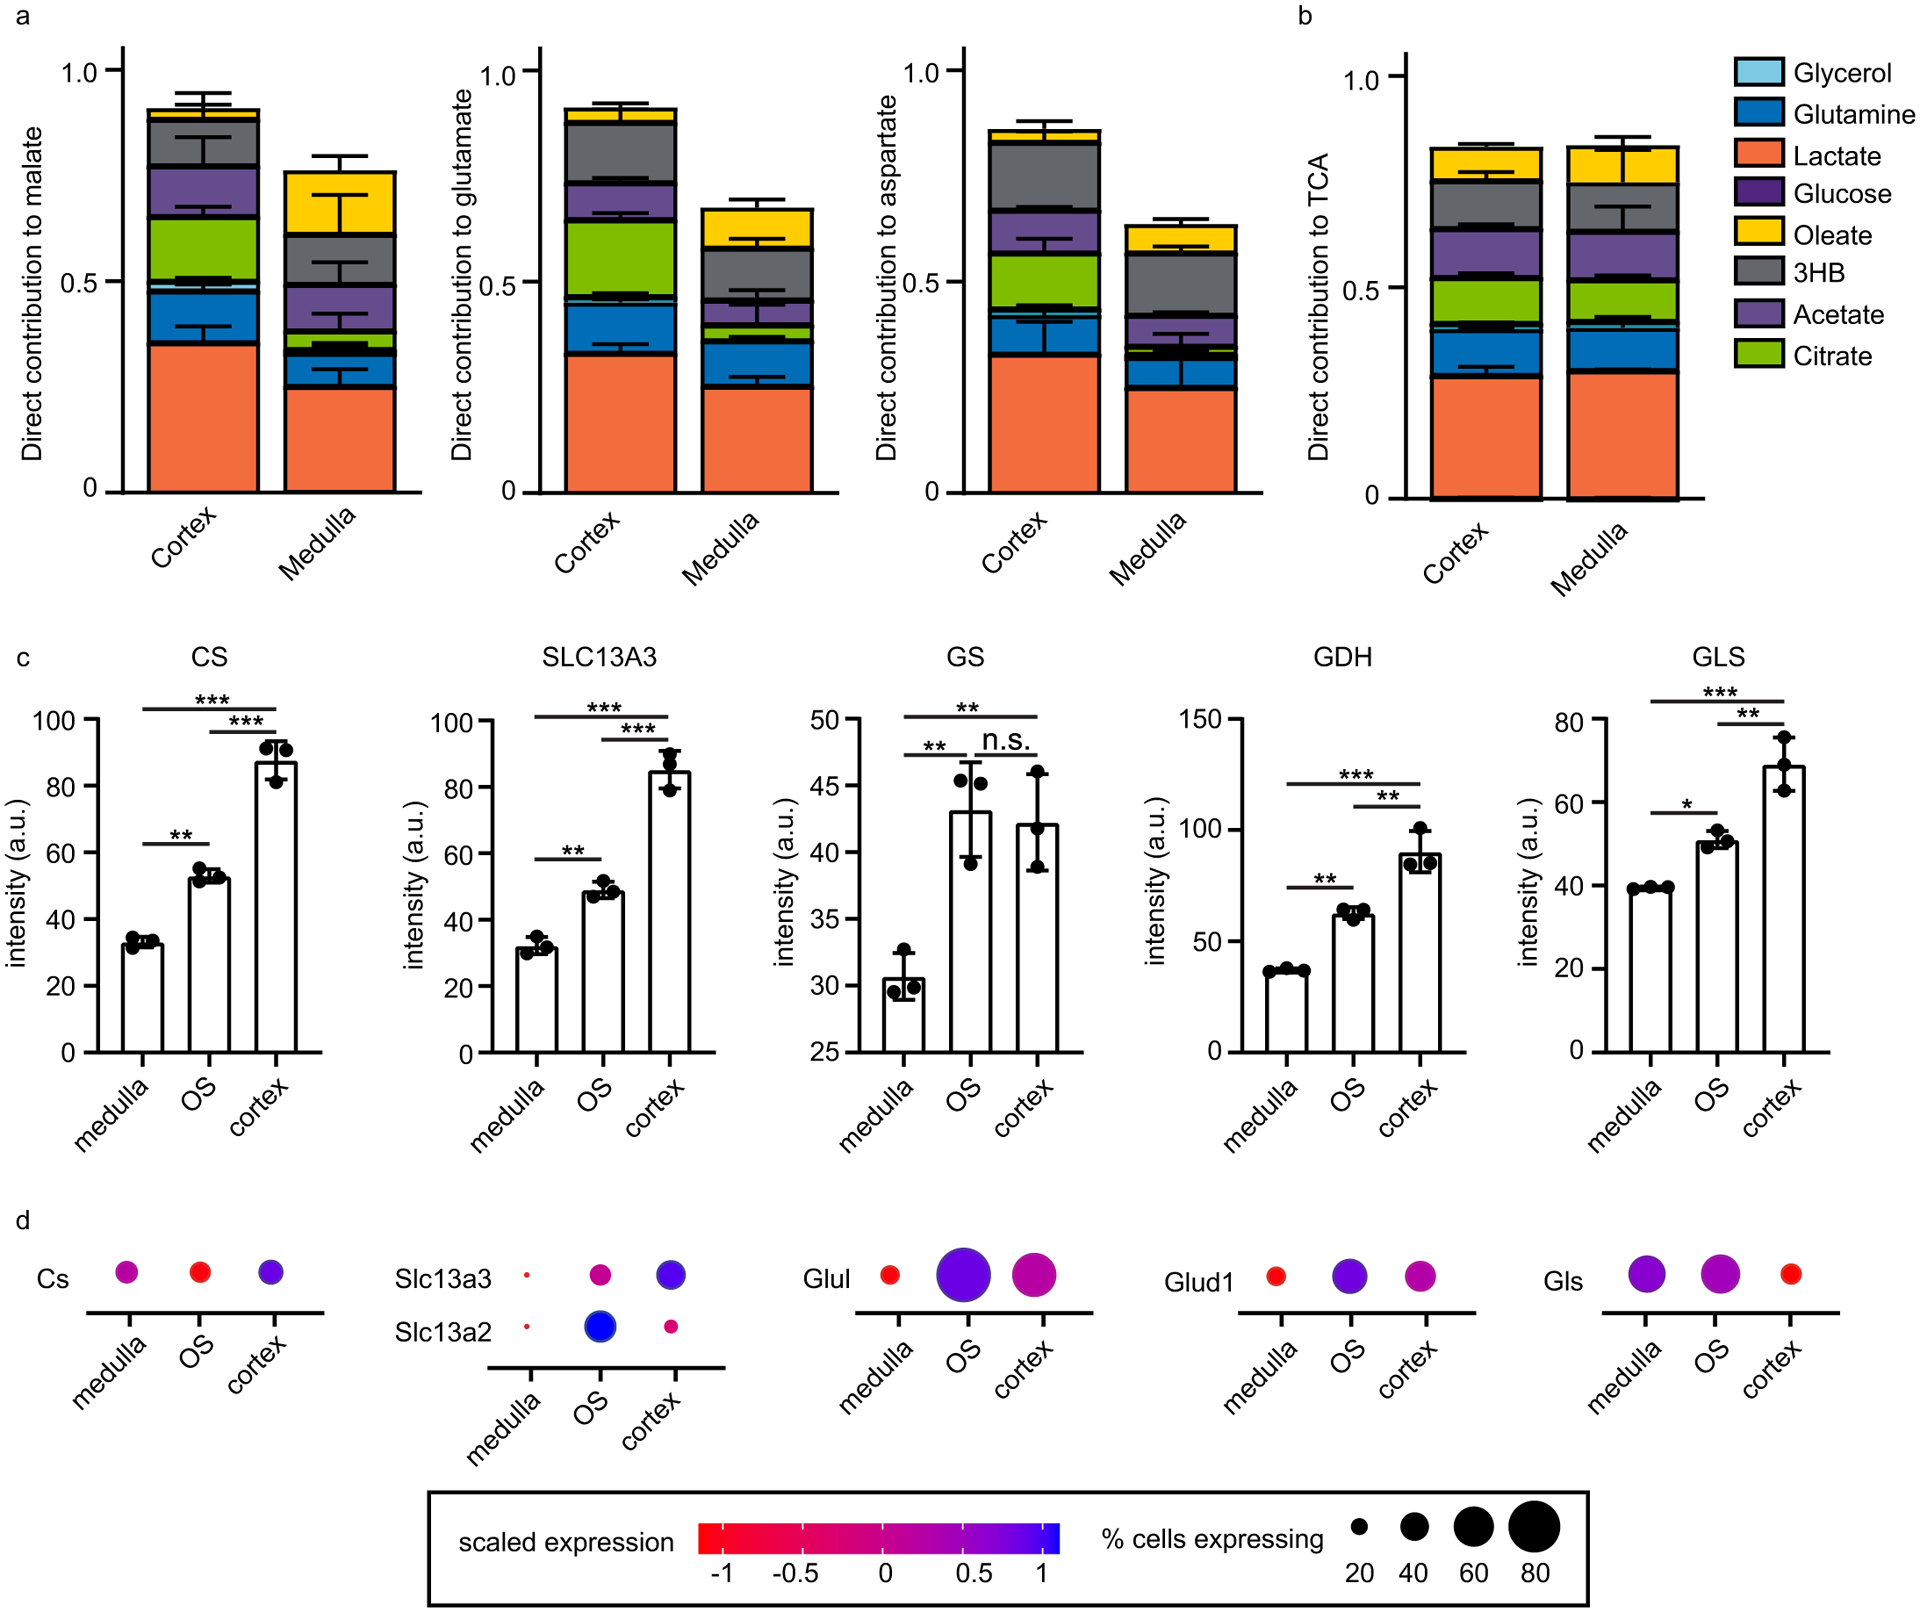
a The direct contribution of each nutrient tracer to malate, glutamate, and aspartate in the cortex and medulla of the murine kidney. b The direct contribution of each of the nutrient tracers to the metabolites in equilibrium with TCA cycle intermediates by LC–MS (homogenized tissue slice) compared to MALDI (whole tissue area). c Quantification of fluorescence intensity in 3 ROIs per region of the kidney in images in Fig. 3b, d. Groups were compared by one-way ANOVA. *** indicates p value <0.0001, ** p < 0.001, * p < 0.05, n.s. not significant. d Region-specific expression levels and percent of cells expressing each metabolic enzyme based on single-cell RNA-sequencing of murine kidney. n = 3 for all tracers. Data are mean + /− s.d.