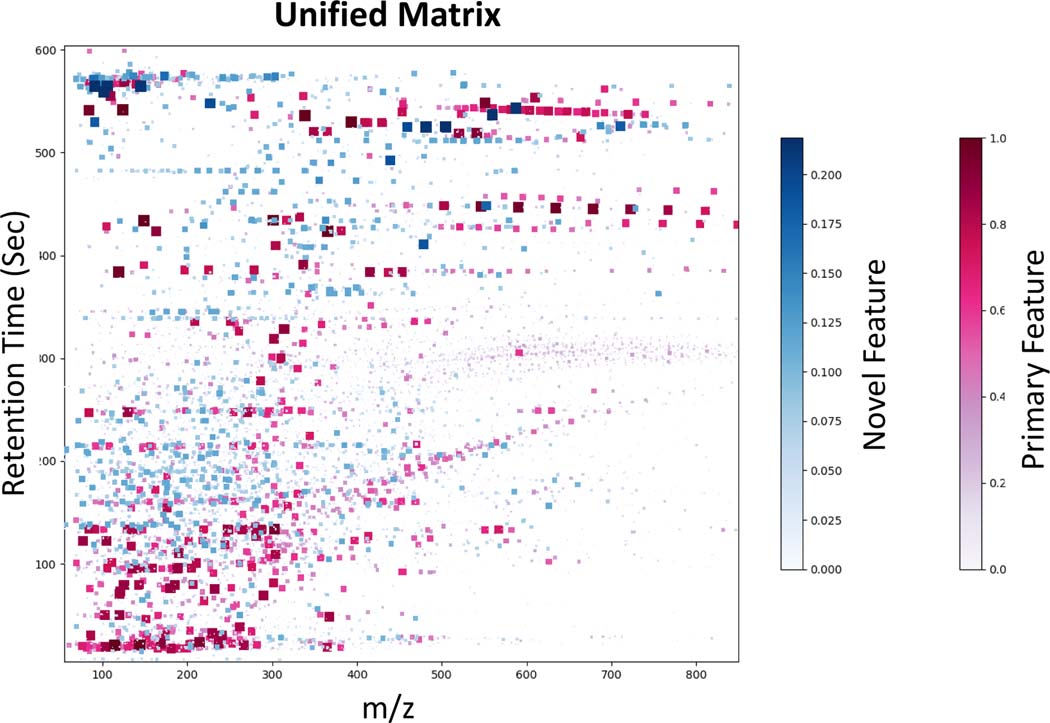
Figure 5.
A visual representation of the unified matrix created from the integration of 4 datasets by DIMEDR. Each marker represents a spectral feature, plotted by its m/z value (X-axis) and retention time (Y-axis). Markers shaded in red represent primary features that were originally found in the primary TBI dataset. Blue shaded markers represent novel features that were found to be present only in the 3 target sets. The size and hue of each marker is a function of the fraction of the total sample count the spectral feature was found to be present in. As such, the upper limit of the novel feature fraction is 85 out of 389 (0.2185), which is reflected in the novel feature color bar.

