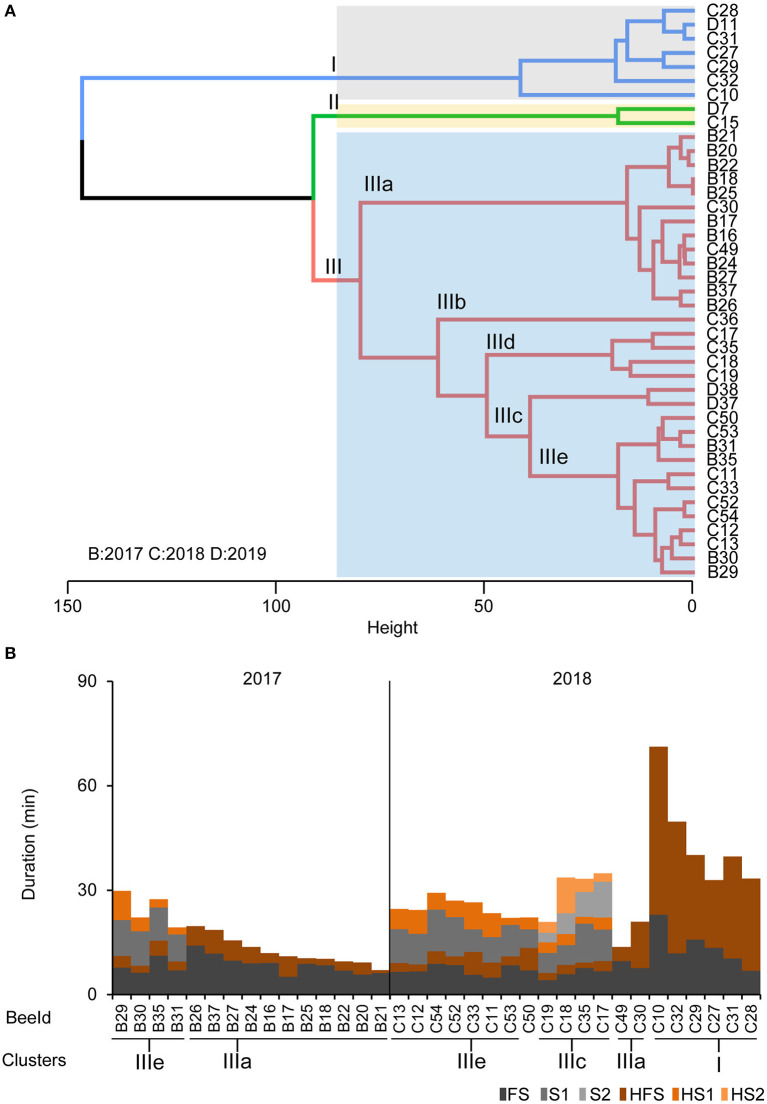
Figure 4.
Phenotypes of the collected foragers. (A) Hierarchical clustering of foragers collected during search phase based on search behavior sequences. The maximum average silhouette width 0.52 gave a three-cluster solution with agglomerative coefficient 0.94. (B) Search behavior sequences for the foragers from the collection experiments along with cluster information. Only bees used for cluster analysis of neurotransmitter titers are shown.

