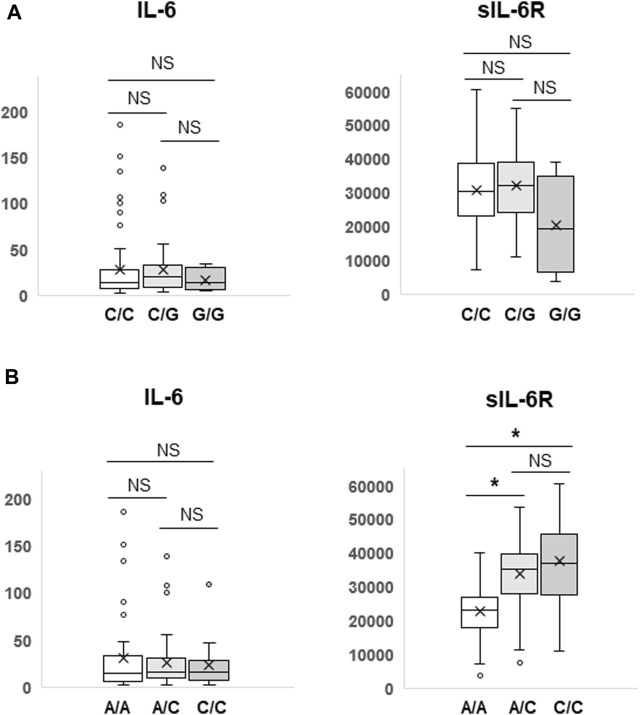
FIGURE 3.
Differences in plasma IL-6 and sIL-6R levels according to the IL-6 (−634G>C) or IL-6R (48892A>C) polymorphism. Plasma IL-6 and sIL-6R levels were compared among three subgroups according to the IL-6 (−634G>C) (A) or IL-6R (48892A>C) (B) polymorphism by Student’s t-test. Data are presented as box plots. The bottom and top of the box represent the first and third quartiles, and the band and “X” inside the box correspond to the median and mean, respectively. Whiskers indicate the variability outside the upper and lower quartiles. Outliers are shown as individual points. *p < 0.001. NS, not significant (p > 0.05).

