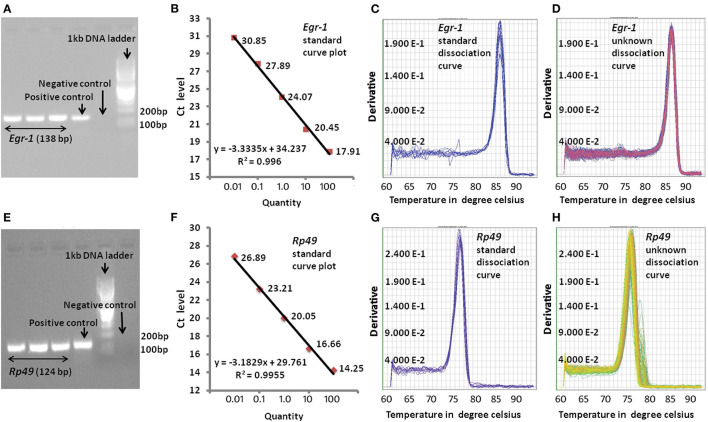
Figure 1.
Representative pictures of qPCR analysis. (A) qPCR product gel electrophoresis for Egr-1 on 2% agarose gel, (B) standard curve for Egr-1 with R2 = 0.0993, (C) dissociation curve for Egr-1 standard cDNA amplification, (D) dissociation curve for Egr-1 unknown cDNA amplification, (E) qPCR product gel electrophoresis for Rp49 on 2% agarose gel, (F) standard curve for Rp49 with R2 = 0.994, (G) dissociation curve for RP49 standard cDNA amplification, and (H) dissociation curve for Rp49 unknown cDNA amplification.

