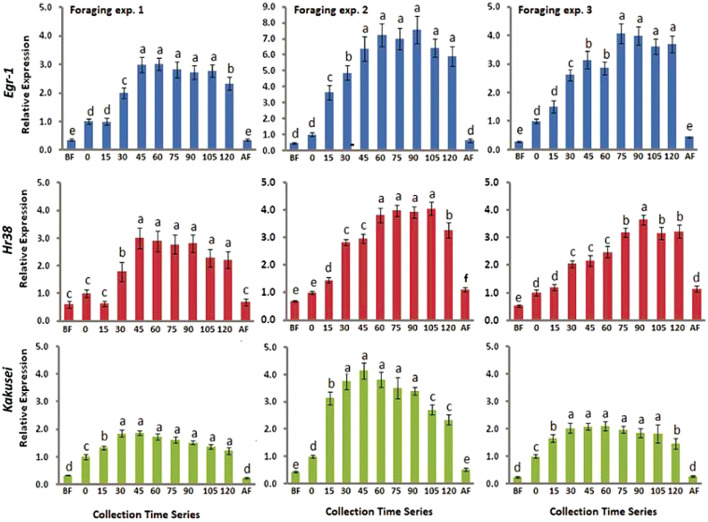
Figure 2.
Bar graphs for three IE gene expression during, before, and after foraging. Blue, red, and green represent Egr-1, Hr38, and Kakusei expression during foraging at a known feeder. Data are shown as fold changes with respect to 0 min (mean value was set as 1), which indicates the presentation of the feeder and start of continuous foraging. BF, before foraging and AF, after foraging. Foraging experiments 1, 2, and 3 represent three independent replicate experiments. Statistical significance was calculated using one-way ANOVA with Tukey-Kramer post-hoc multiple comparison tests and significant levels were represented by p-values. p ≥ 0.05 is considered to have no significant difference and p < 0.05 is considered to be significantly different between the means. The statistical difference between the adjacent groups is represented by letters a, b, c. Same letters above the adjacent error bars represent no significant difference and different letters represent a significant difference. Sample size for each time point is n = 5.

