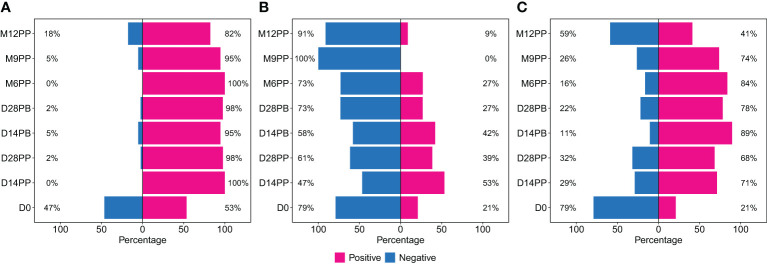
Figure 2.
Rates of Spike Protein-Directed Seroconversion Following Pfizer-BioNTech COVID-19 (BNT162b2) Vaccination. This figure shows the percentage of participants who seroconverted at each time point. Using cutoffs of 0.432 for S-IgG, 0.459 for S-IgM, and 0.226 for S-IgA, the 320 samples were categorized as either positive or negative for IgG (A), IgM (B) and IgA (C) antibodies. The bar graphs represent the proportion of participants with positive or negative status at each interval.

