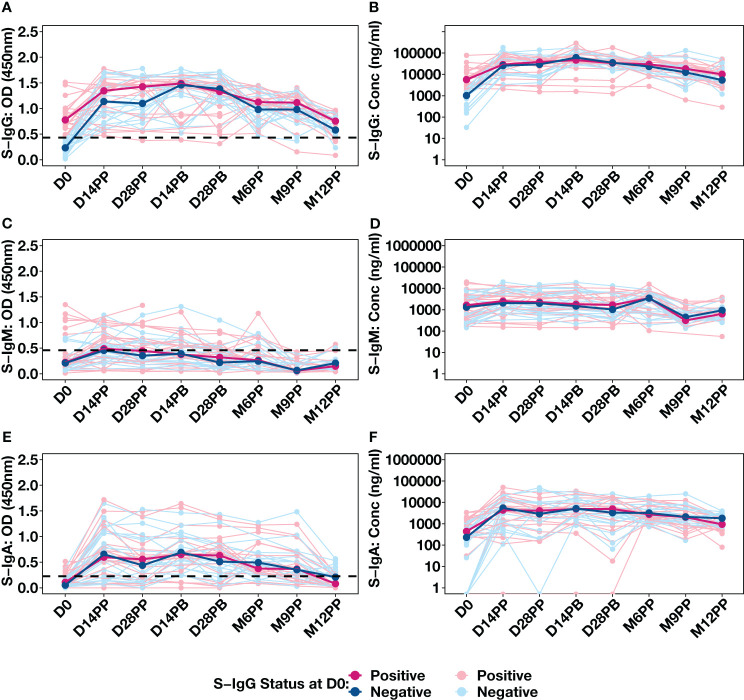
Figure 4.
Individual Antibody Response Profiles Categorized by Baseline Spike Protein IgG Seropositivity. This figure shows the antibody responses against the Spike protein, including IgG (A, B), IgM (C, D), and IgA (E, F). Participants were colour-coded based on S-IgG seropositivity at baseline: positive in pink (S-IgG levels ≥ S-IgG cutoff) and negative in blue. Thick lines indicate group median values, while thin lines depict individual profiles.

