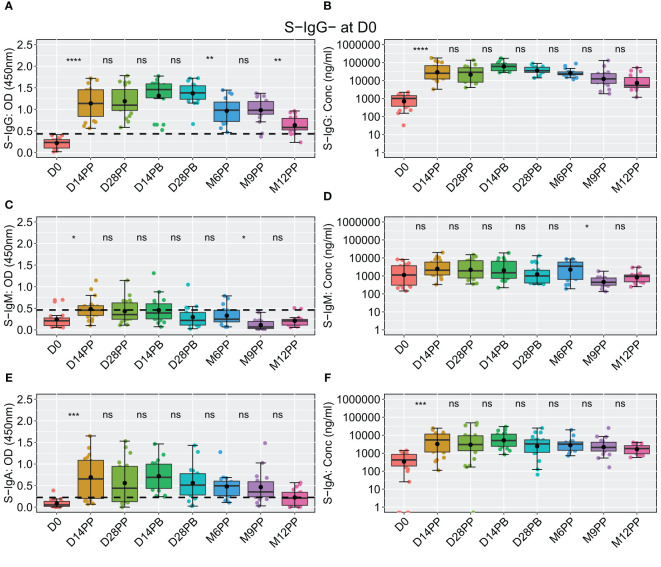
Figure 7.
Comprehensive Analysis of the Pfizer-BioNTech BNT162b2 Vaccine-induced Spike-Directed Antibody Responses in S-IgG- Participants Over Time. Illustrates the dynamics of the Pfizer-BioNTech BNT162b2 vaccine-induced Spike-directed antibody responses (IgG, IgM, IgA) in 20 participants initially lacking anti-spike IgG (S-IgG) at baseline (Day 0). Panels (A–F) show the distribution of antibody optical density (OD) levels and concentrations in ng/ml across time points for IgG (A, B), IgM (C, D), and IgA (E, F). Statistical analysis involved the Wilcoxon test for unpaired pairwise comparisons, with Bonferroni correction for multiple testing, to address missing data points. Boxplots display median (line), mean (black circle), and quartile values (box edges). Significance levels are indicated as: ns (p > 0.05), *(p ≤ 0.05), **(p < 0.01), ***(p < 0.001), ****(p < 0.0001).

