Figure 4.
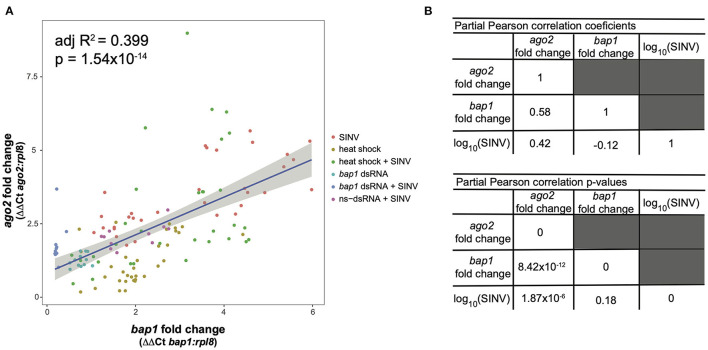
Expression of bap1 and ago2 is associated after accounting for the effect of virus abundance. The relative expression of bap1 and ago2 in bees that received a variety of treatments was assessed by qPCR relative to mock infected bees. (A) Bap1 and ago2 fold changes are associated in bees that received a variety of treatments (adjusted R2 = 0.399, p = 1.54 × 10⁻¹⁴). (B) A partial Pearson's correlation coefficient was calculated to test for a correlation between bap1 and ago2 expression after accounting for the effect of virus (SINV) abundance. While there is a correlation between ago2 and SINV level (r = 0.42, p = 1.87 × 10⁻⁶) there was no correlation between bap1 and SINV. After accounting for the effect of SINV on ago2 expression, there is a strong correlation between ago2 and bap1 (r = 0.58, p = 8.42 × 10⁻¹²).

