Fig. 6.
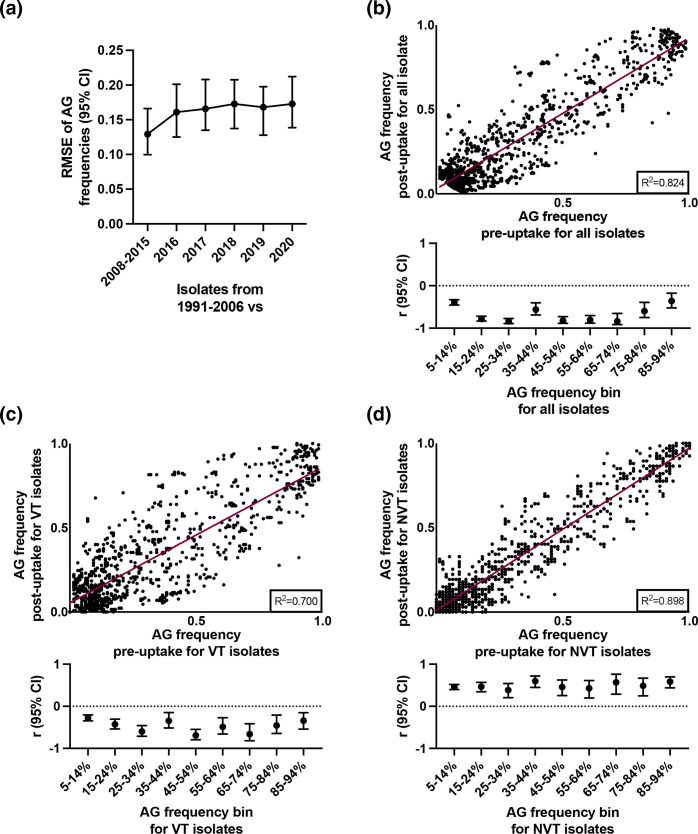
Accessory gene (AG) changes over time. Average change in AG frequency through time, using root mean square error (RMSE) to contrast frequencies from earlier versus later isolation dates (a). Bars indicate 95 % confidence intervals. The relationship between AG frequency in the PCV pre- vs post-uptake time periods for all isolates (b), vaccine type (VT) isolates (c) and non-vaccine type (NVT) isolates (d). The correlation coefficient (r) within 10 % frequency bins is shown below each plot, and bars indicate 95 % confidence intervals. The bins were defined from the AG frequencies among all isolates.

