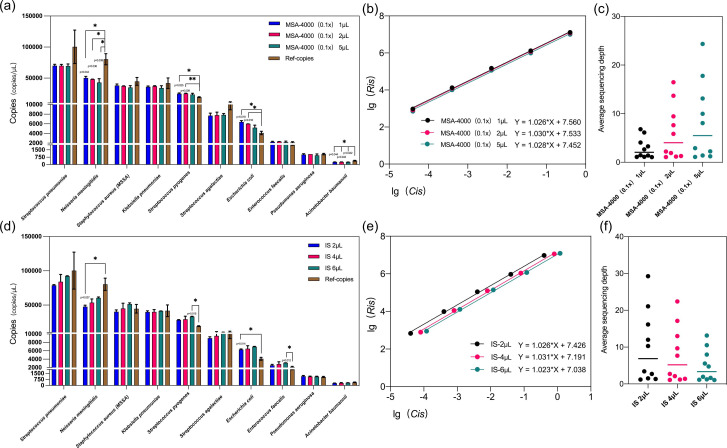
Fig. 2.
The quantitative accuracy of KCQ. (a) The effect of different MSA-4000 inputs on the quantition by KCQ. Ref-copies were copies quantified by ATCC through ddPCR. MSA-4000 0.1 x was prepared by 1 : 10 dilution in the buffer. Different input volumes of 1 µL, 2 µL or 5 µL of the diluted MSA-4000 were added before the library preparation. A t-test analysis of resulting KCQ copy numbers versus Ref-copy numbers was performed, and the groups with P<0.05 were labelled with * and those with P<0.01 were labelled with **. (b) Regression curves of IS under different MSA-4000 input volumes. Ris: the number of IS sequences detected, Cis: the inputs of IS. (c) Average sequencing depth of microorganisms under different MSA-4000 inputs. (d) The effect of different IS inputs on the quantitation by KCQ. Then 2 μL, 4 µL or 6 µL of IS were added before the library preparation. A t-test analysis of resulting KCQ copy numbers versus Ref-copy numbers was performed, and groups with P<0.05 were labelled with *. (e) Regression curves of IS under different IS input volumes. Ris: the number of IS sequences detected. Cis: the inputs of IS. (f) Average sequencing depth of microorganisms under different IS inputs.

