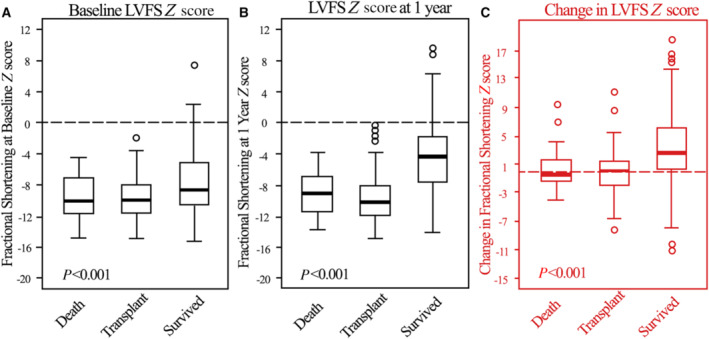
Figure 5. Progression of LV fractional shortening Z score.

Left ventricular fractional shortening Z scores at (A) diagnosis/(baseline), (B) 1 year later, and (C) changes between baseline and 1 year for children with dilated cardiomyopathy who died, underwent heart transplant, or survived during the first year after diagnosis. Data in the box‐and‐whisker plots are medians, interquartile ranges, minimum and maximum within median±1.5 interquartile range and outliers. The groups differed significantly at both time points, as well as in respect of the improvement in LVFS from 0 to 1 year (C). LVFS indicates left ventricular fractional shortening.
