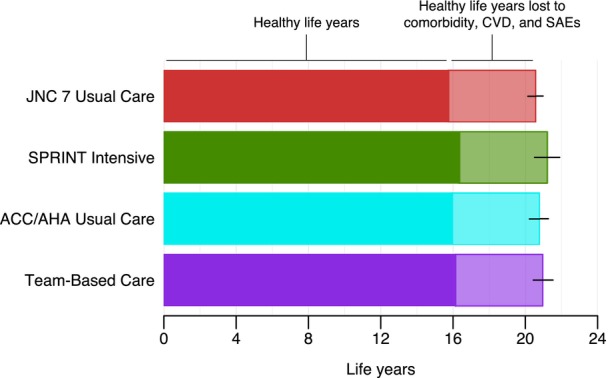
Figure 3. Estimated survival and healthy life years in US adults meeting SPRINT eligibility criteria.

The figure shows the mean survival from baseline with each hypertension management strategy in a population weighted to all 18.1 million SPRINT‐eligible US adults. The results are presented as the mean and 95% uncertainty interval (error bar) calculated by running 200 probabilistic iterations in which the model was run repeatedly when randomly sampling input parameters from prespecified statistical distributions. The solid region indicates the healthy life years, which adjusted survival for acute CVD events, chronic CVD, intolerable adverse events, SAEs, hypertension, dyslipidemia, obesity, diabetes, end‐stage renal disease, and other comorbidities with aging. ACC indicates American College of Cardiology; AHA, American Heart Association; CVD, cardiovascular disease; JNC 7, Seventh Report of the Joint National Committee on Prevention, Detection, Evaluation, and Treatment of High Blood Pressure; SAE, serious adverse event; and SPRINT, Systolic Blood Pressure Intervention Trial.
