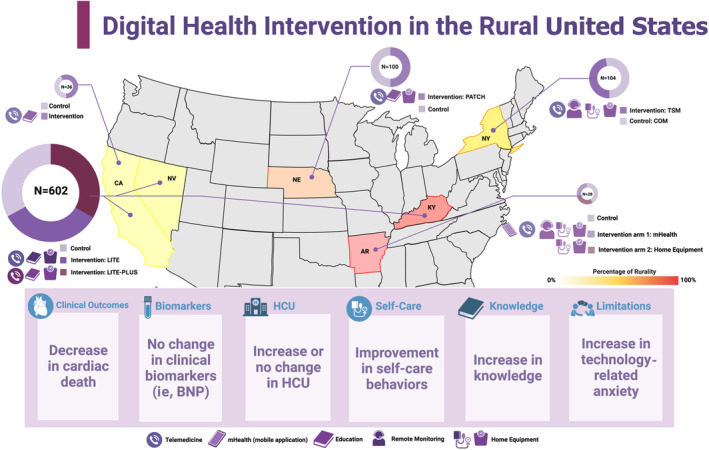
Figure 2. US bubble map based on the location, type of intervention, and number of participants investigated from selected studies.

The figure displays the results of 5 studies between 2005 and 2019 13 , 14 , 15 , 16 , 17 included in this review, which were conducted in underserved rural regions of 6 US states: New York, Nebraska, California, Kentucky, Nevada, and Arizona. All of the studies used digital health technologies, including telemonitoring (via phone or video), remote monitoring (via a call center), or mHealth (via mobile devices), and 4 of the studies provided home equipment such as blood pressure cuffs and scales. The ring pie chart indicates the size of each study, including the number of participants and the proportion of intervention and control groups (represented by different colors). The number of participants in each study is also displayed within the chart. The rurality of each state is illustrated by a heat map, which shows a color gradient ranging from light yellow to indicate 0% rurality, progressively darkening to red to represent areas of 100% rurality (Arkansas (44.5%): pure red, Kentucky (41.3%): red, Nebraska (27%): medium red‐orange, New York (12.6%): light red‐orange, California (5.8%): yellow, Nevada (5.9%): yellow). The heat map categorically delineates the rural nature of each study area based on most recent census data (percentage of the population living in rural areas, rural population density, and rural land area). 18 The boxes provide a summary of the key findings from all of the studies. Created with BioRender.com. BNP indicates B‐type natriuretic peptide; COM, comprehensive outpatient management; HCU, health care use; mHealth, mobile health; and TSM, telehealth self‐monitoring.
