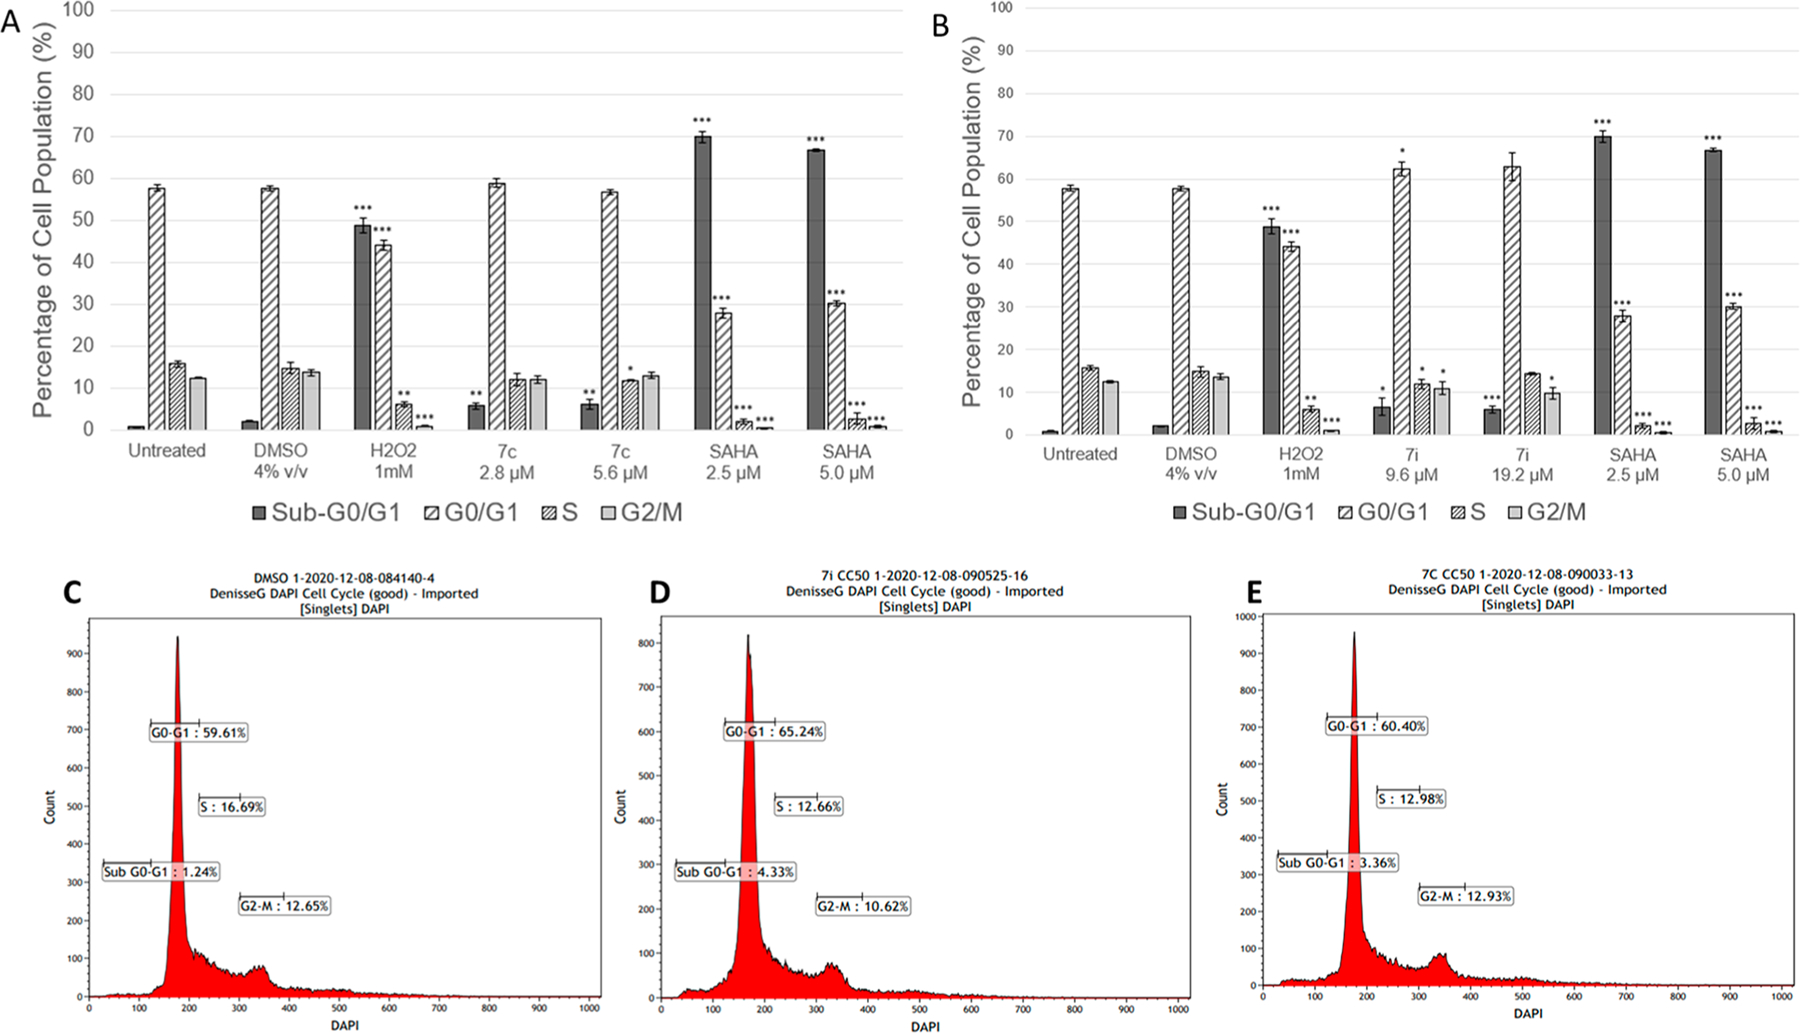
Figure 9.

Cell cycle distributions in CCRF-CEM after 72 h exposure to 7c, 7i, and control SAHA (A). Graphical representation of distribution of the cells treated with 7c, untreated control, DMSO, H2O2, and SAHA (B). Graphical representation of distribution of the cells treated with 7i untreated control, DMSO, H2O2, and SAHA. Histograms of vehicle (C), compound 7i (D), compound 7c (E); n = 3, *p < 0.05, **p < 0.01, ***p < 0.001.
