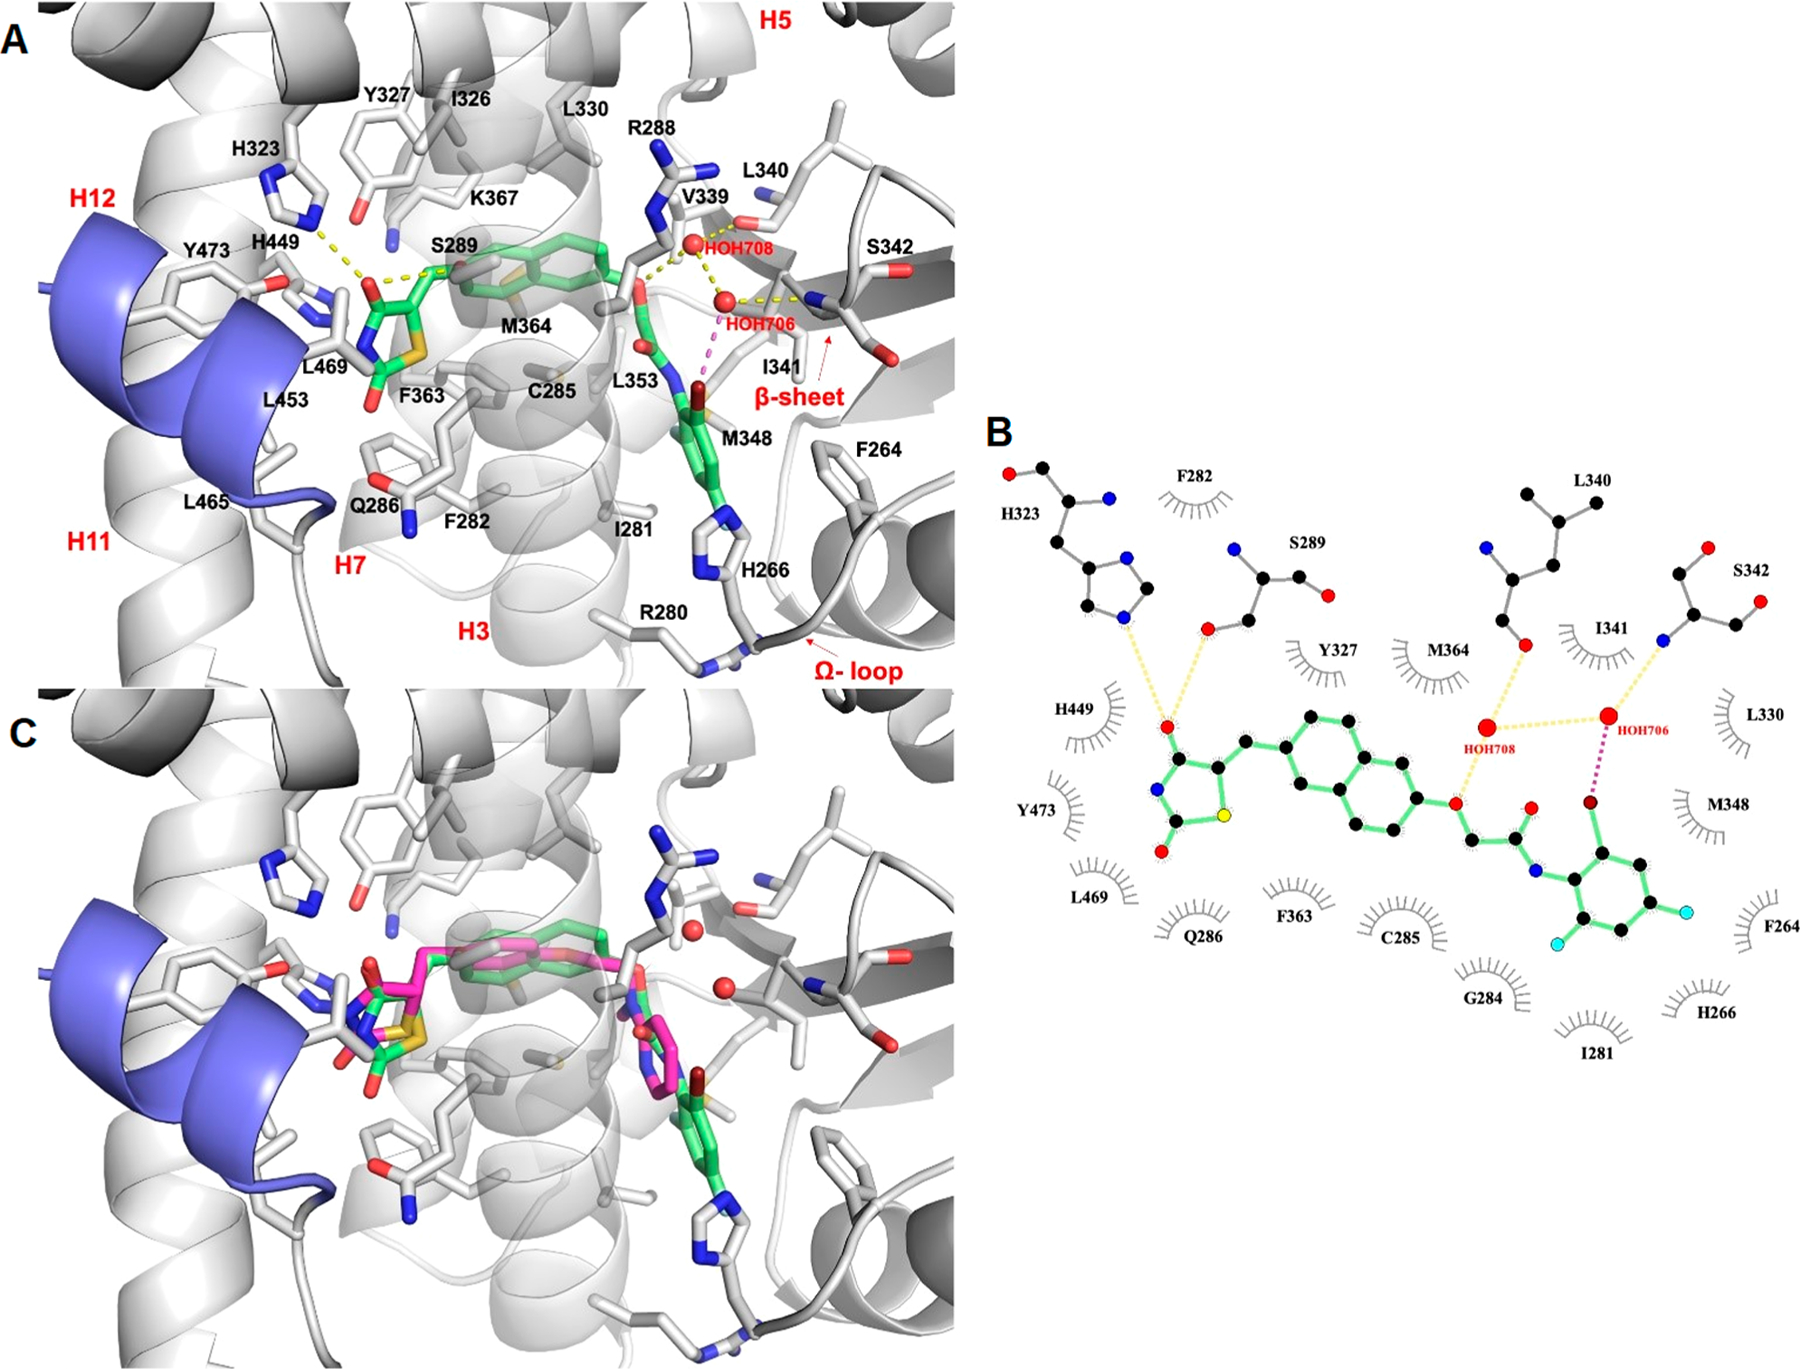
Figure 6.

In silico docking of compound 7i into the PPARγ binding pocket. (A) Binding mode of compound 7i (partial agonist, green sticks) into the PPARγ binding site represented as a gray ribbon model. Only amino acids located within 4 Å of the bound ligand are displayed (white sticks) and labeled. H12 is shown in slate. H-bonds discussed in the text are depicted as dashed yellow lines. The halogen bond is shown as dashed magenta lines. The water molecules bridging the interaction of the ligand with the protein are displayed as red spheres. (B) 2D ligand-interaction diagram of 7i. The plot was generated by LigPlot+. H-bonds are shown as dashed yellow lines, while the halogen bond is shown as dashed magenta lines. The water molecules are displayed as red spheres. The spoked arcs represent residues making nonbonded contacts with the ligand. (C) Cα superposition of the complexes of PPARγ with compound 7i and Rosiglitazone (full agonist, magenta sticks, PDB ID: 4EMA).
